
$2,800Asking Price
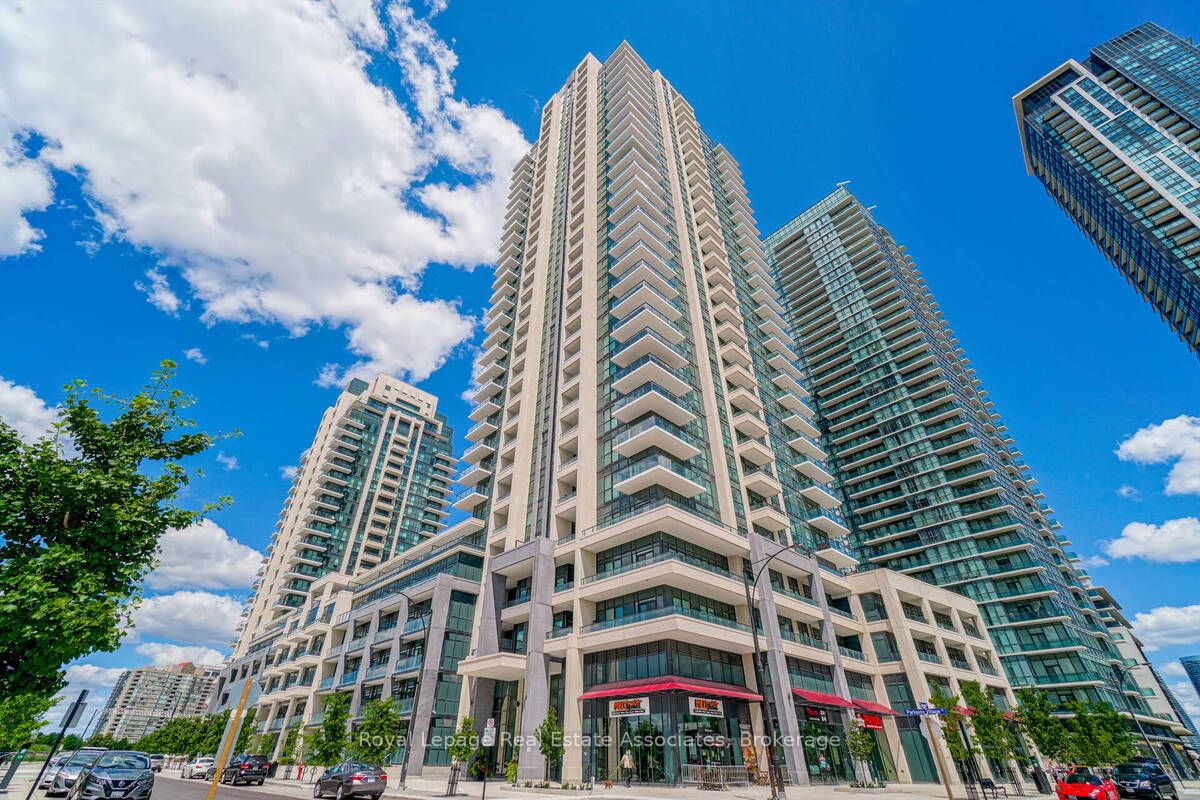
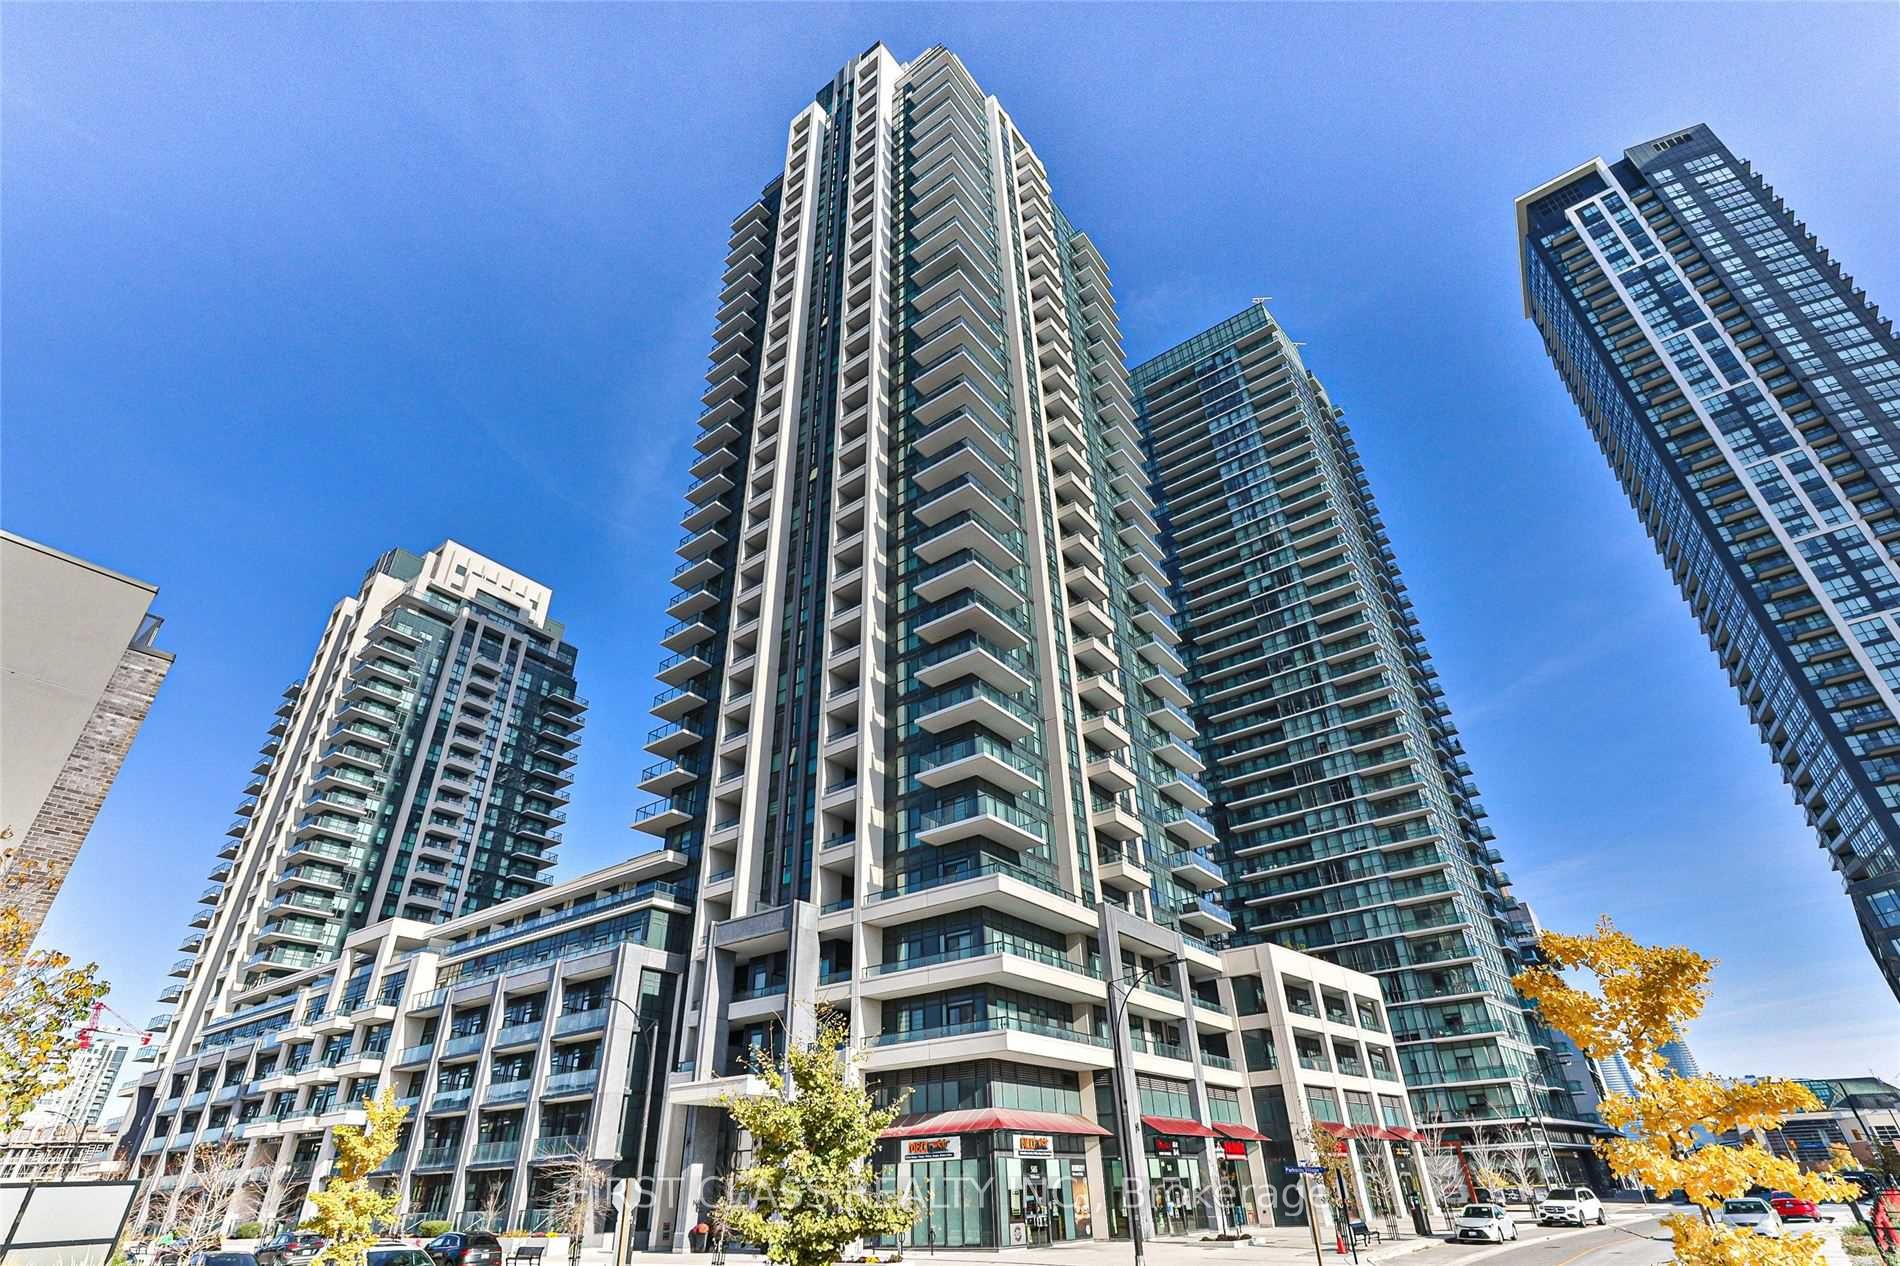
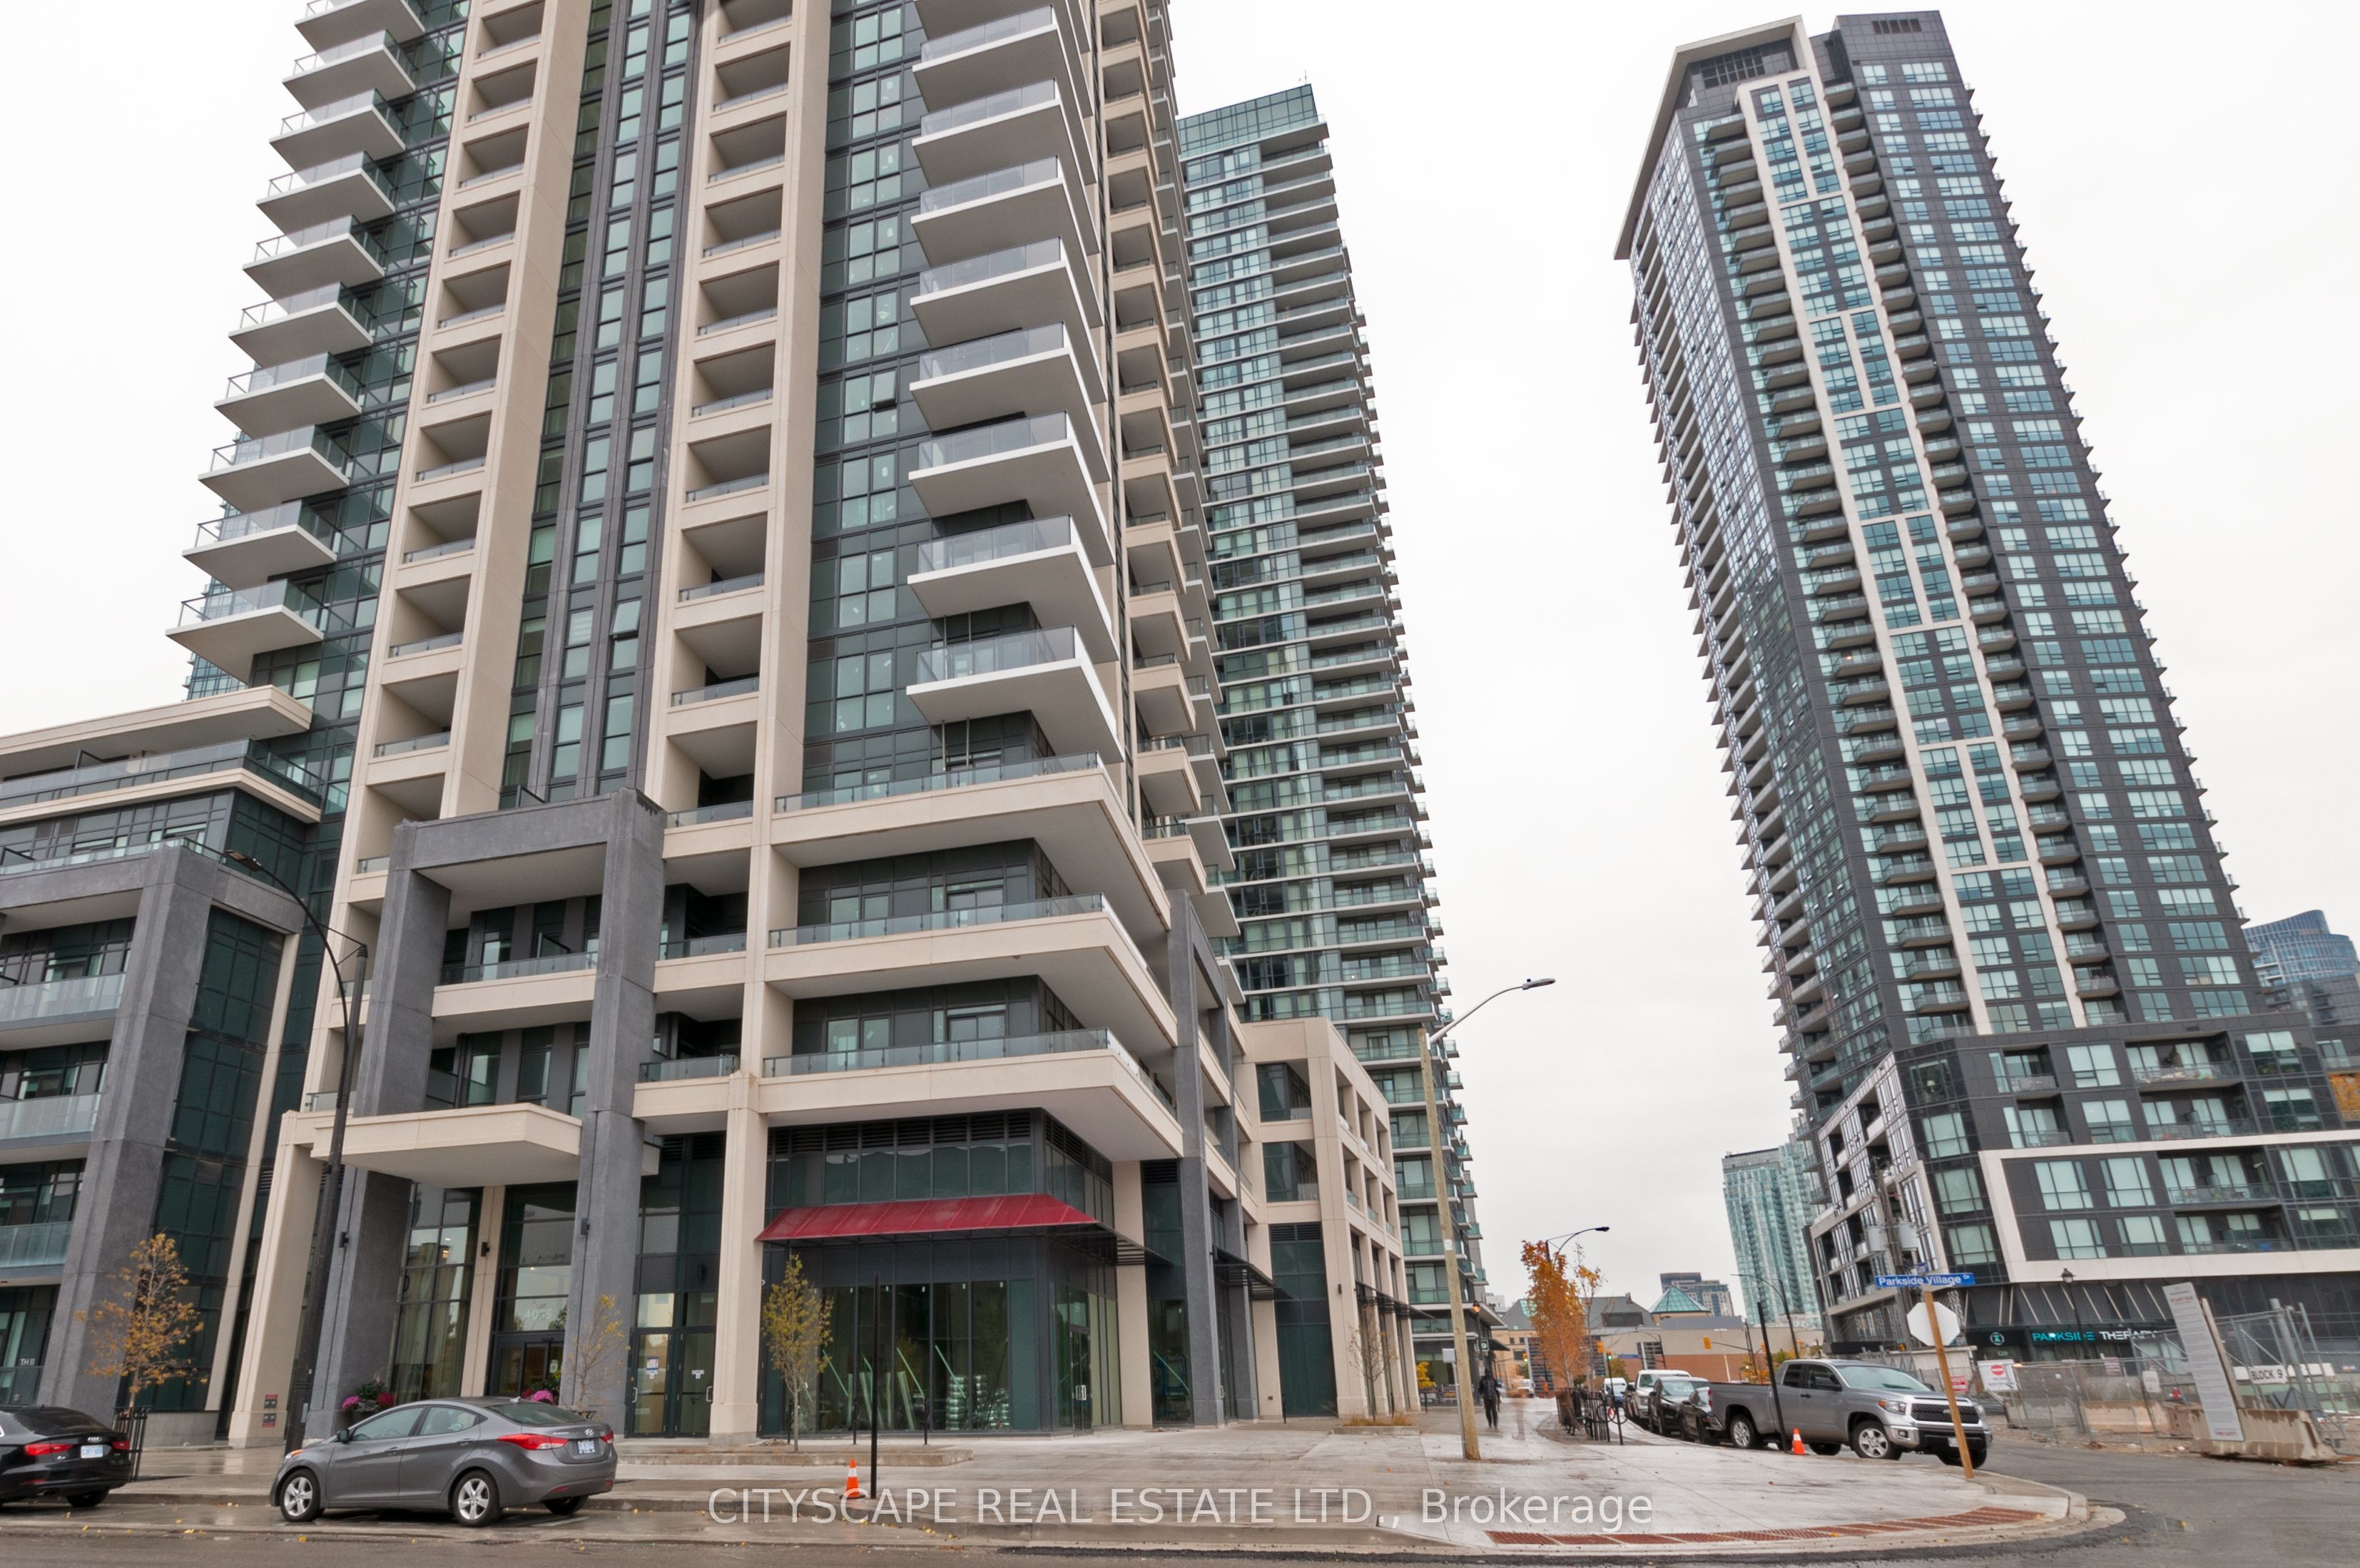
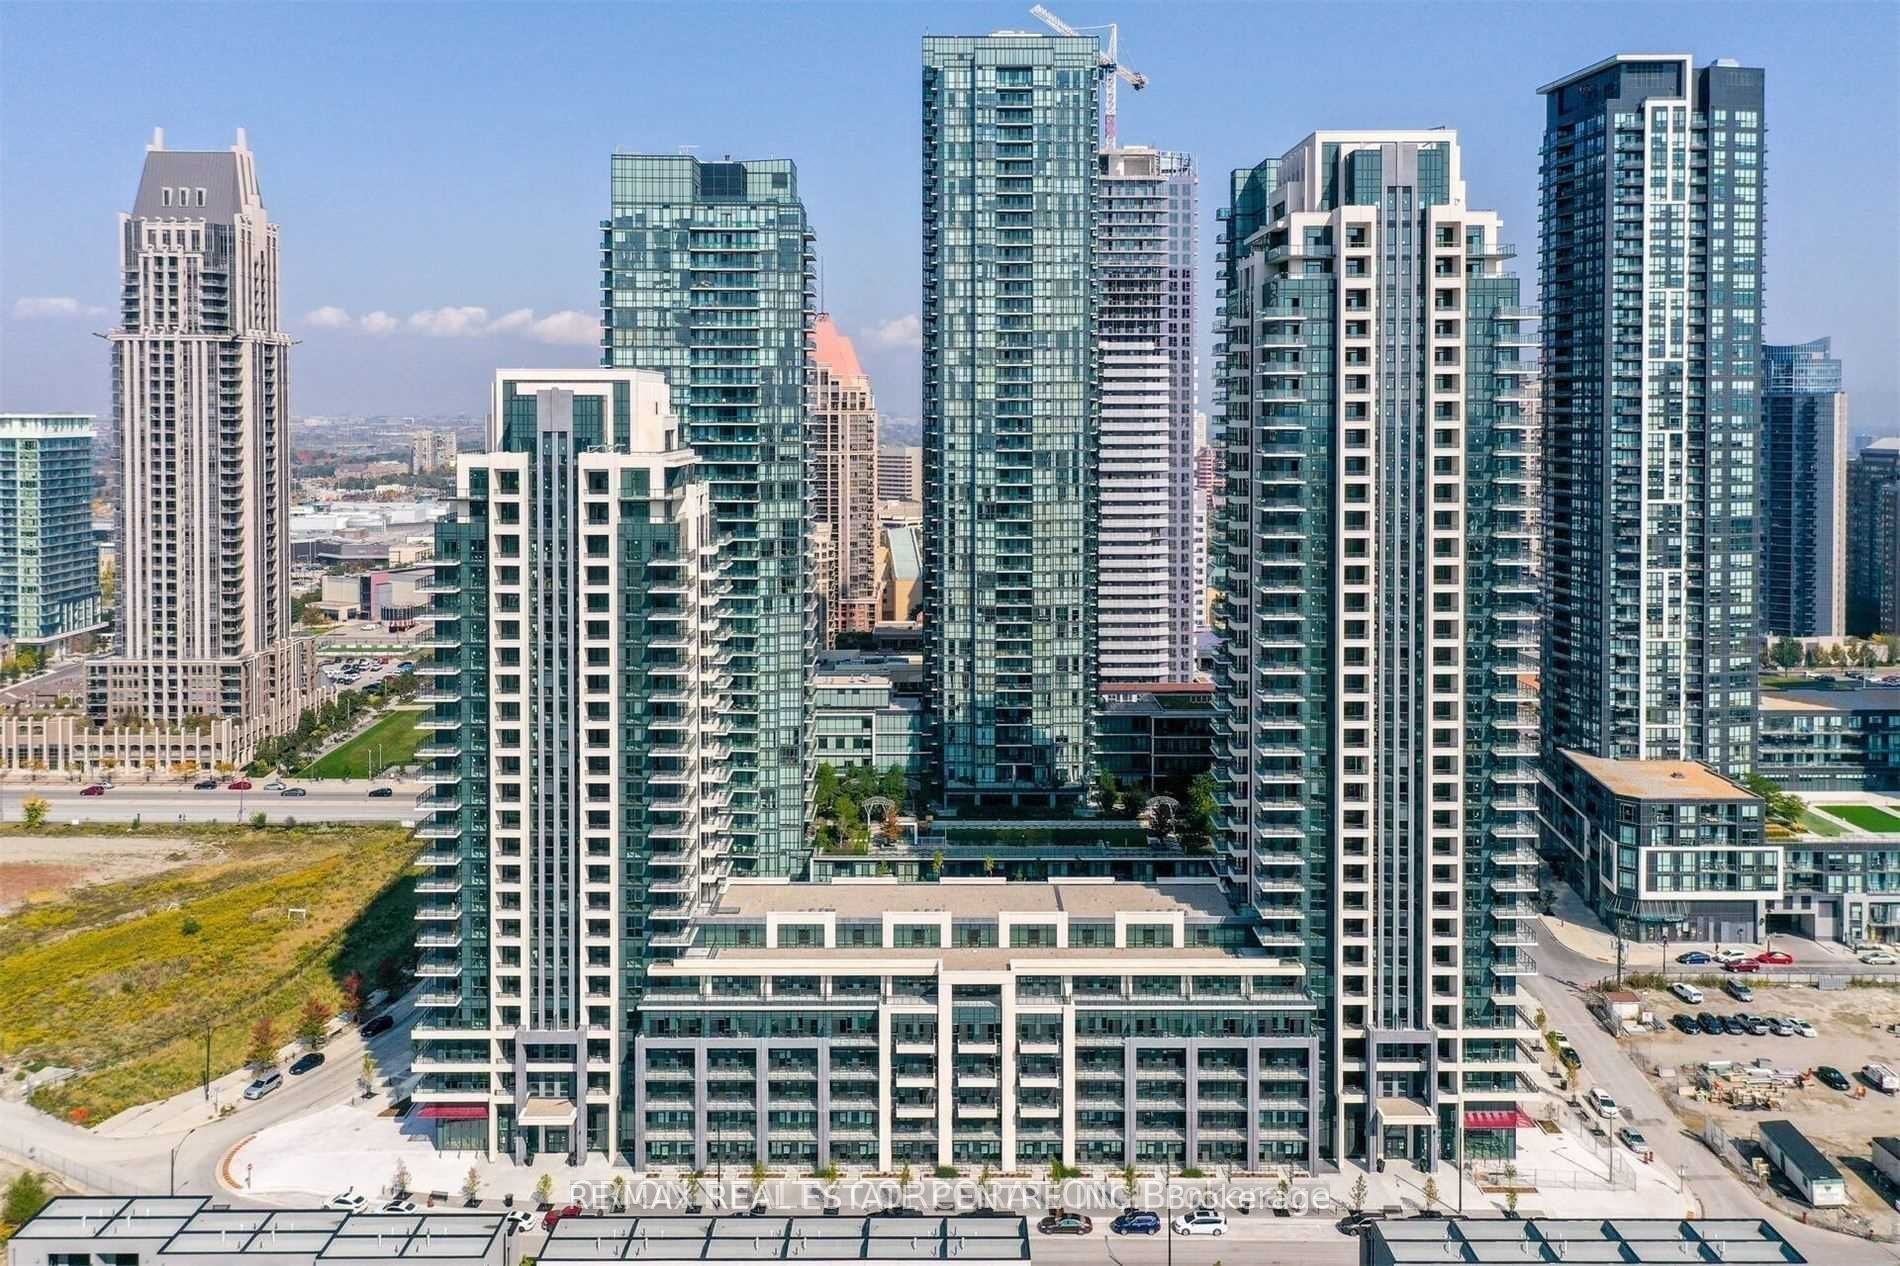
4055 Parkside Village Drive 2918, Mississauga, ON L5B 0K8 #2918
Creditview, Mississauga
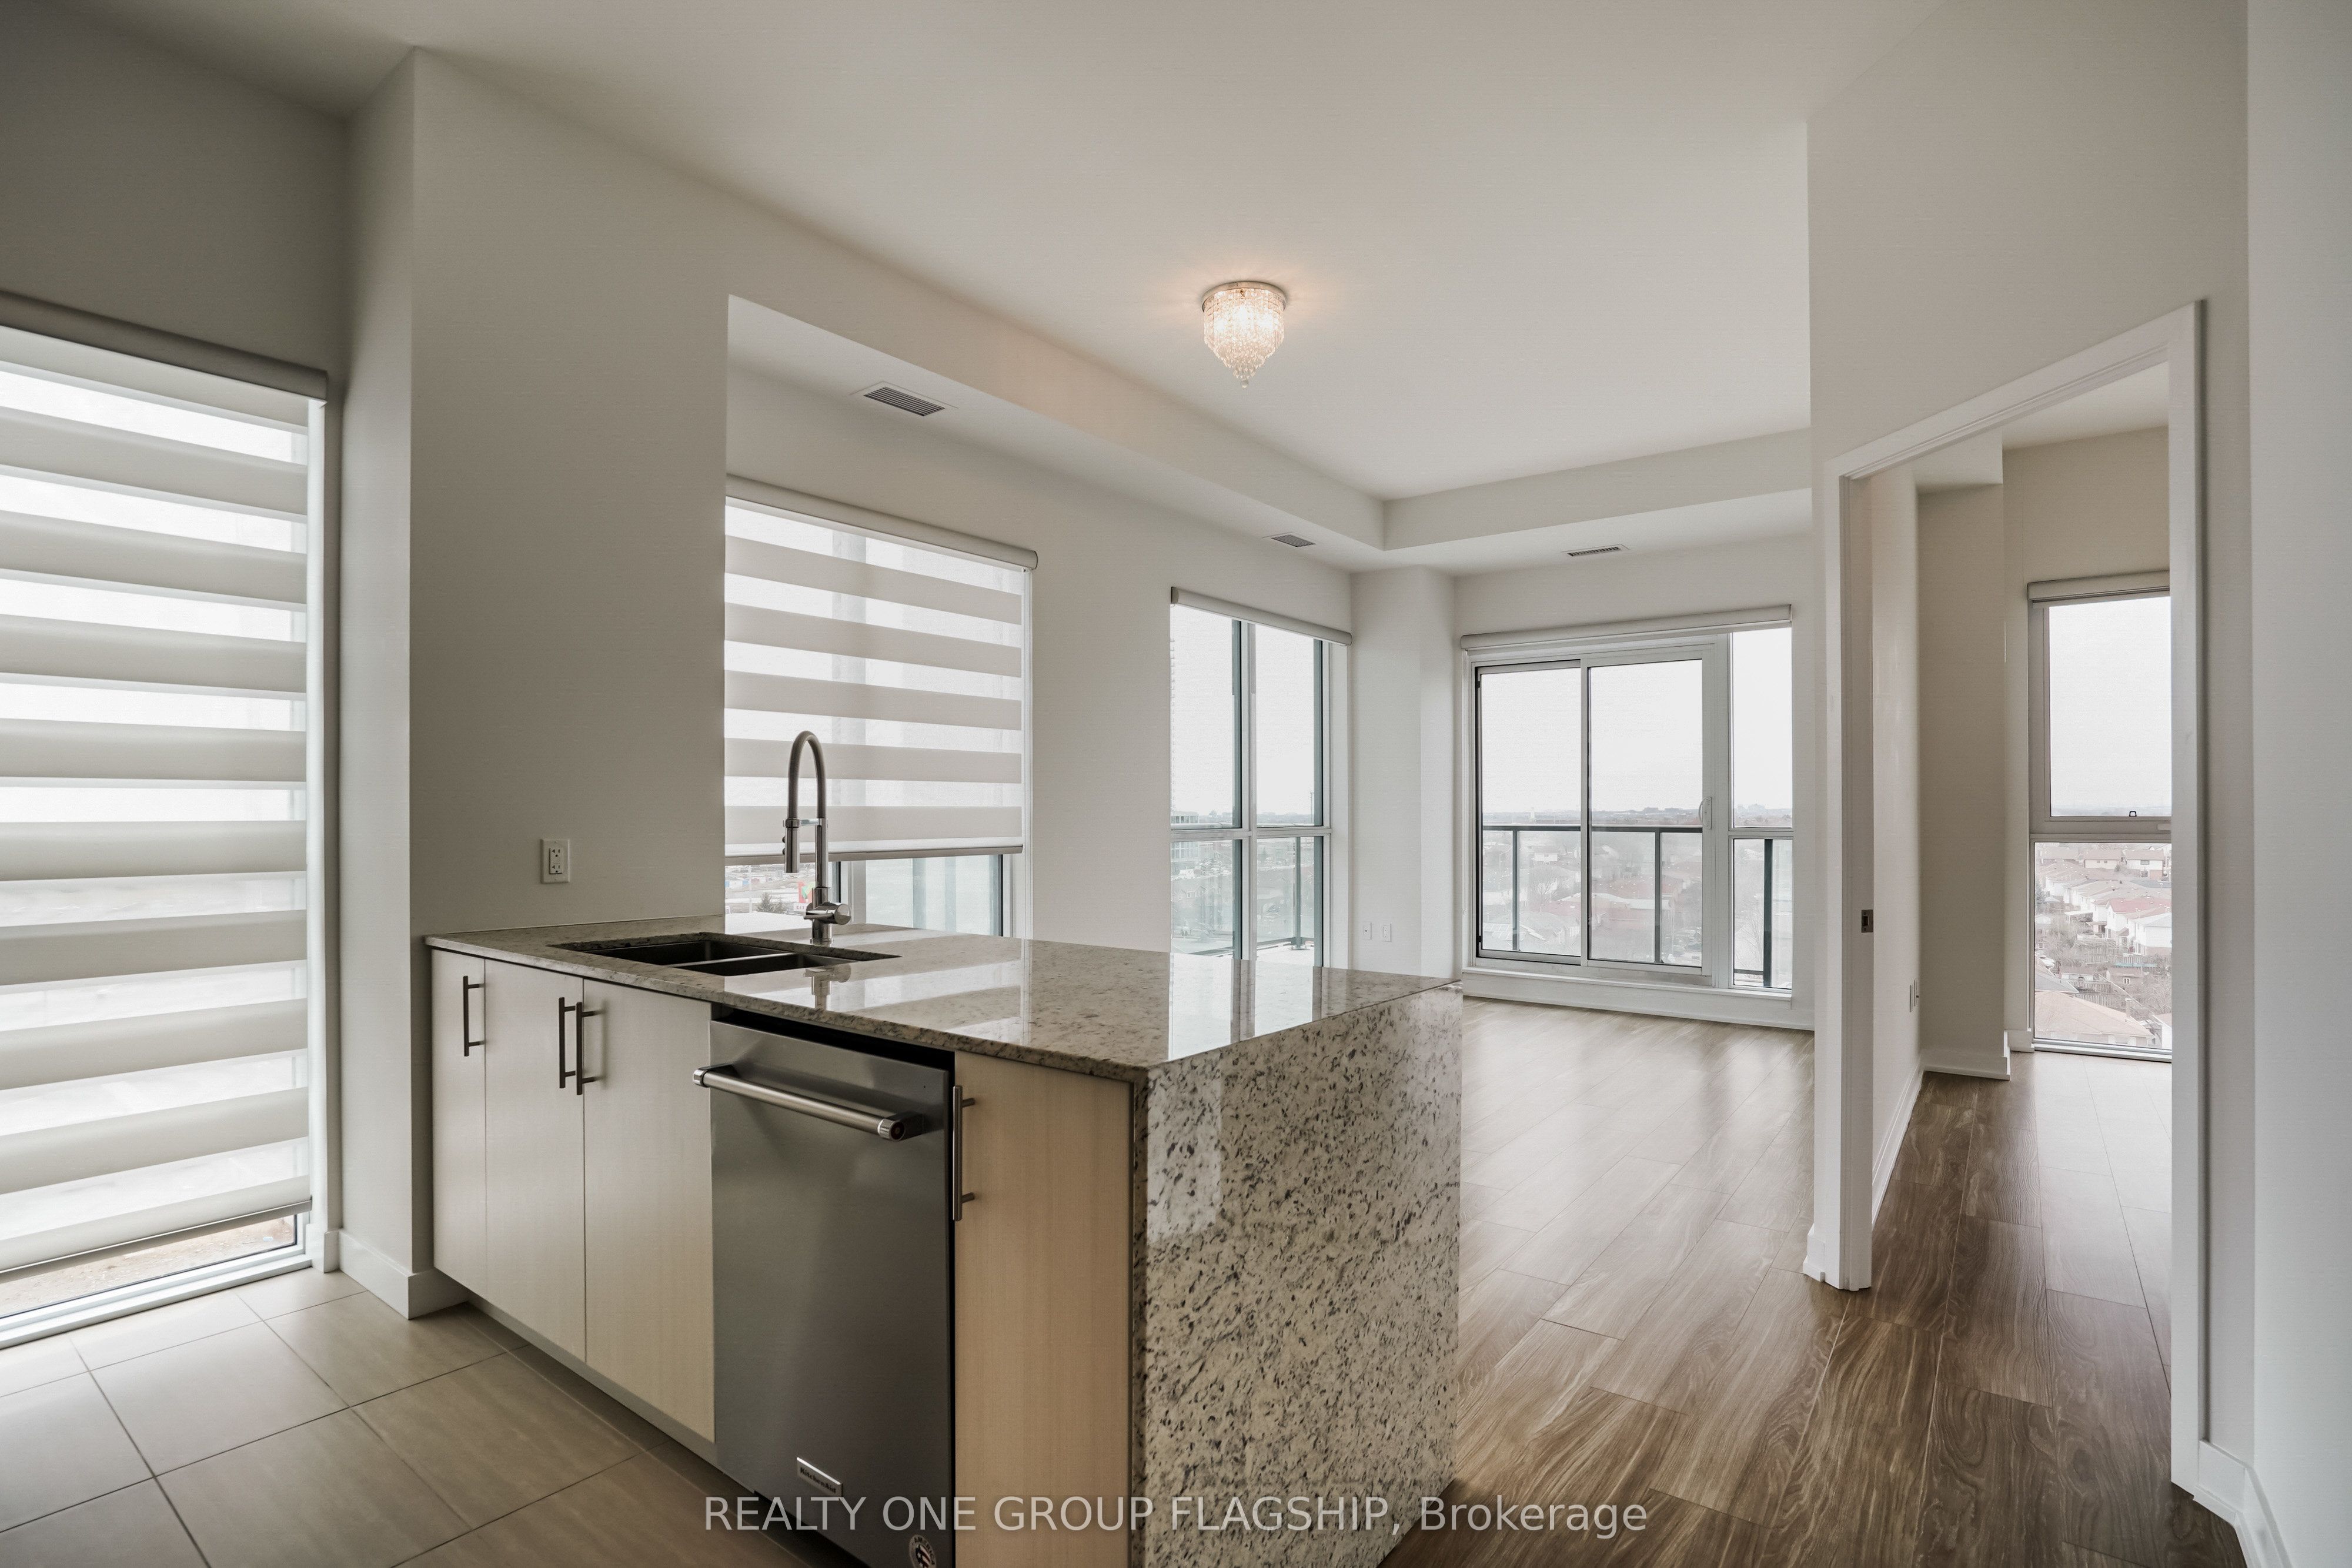
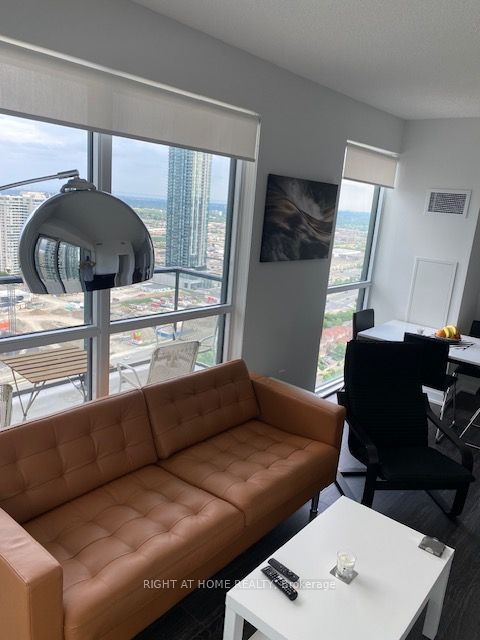
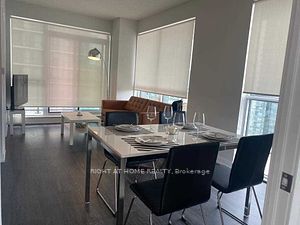
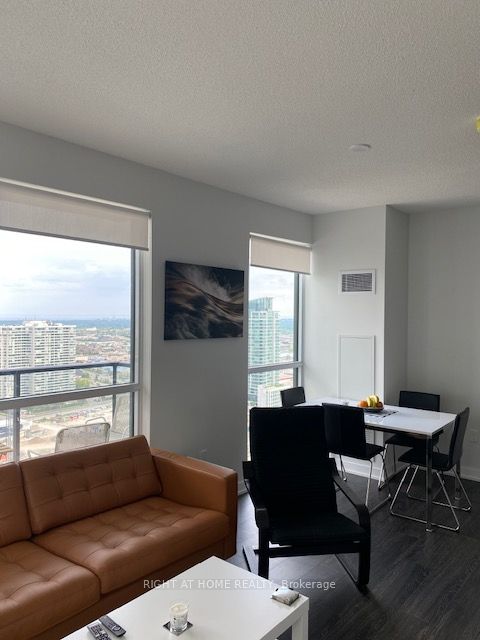
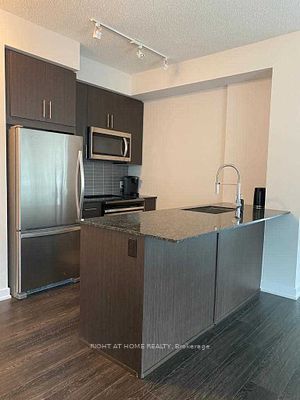
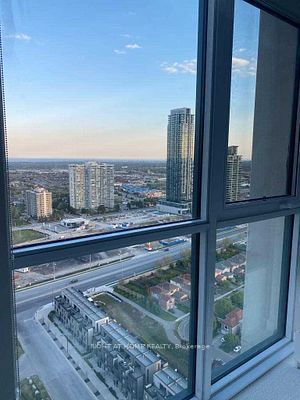
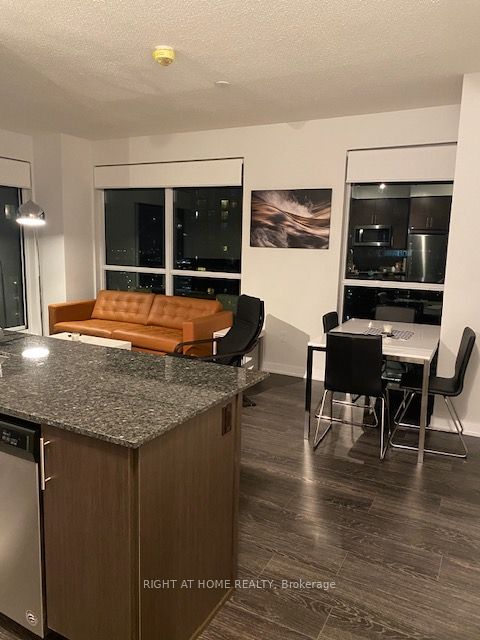
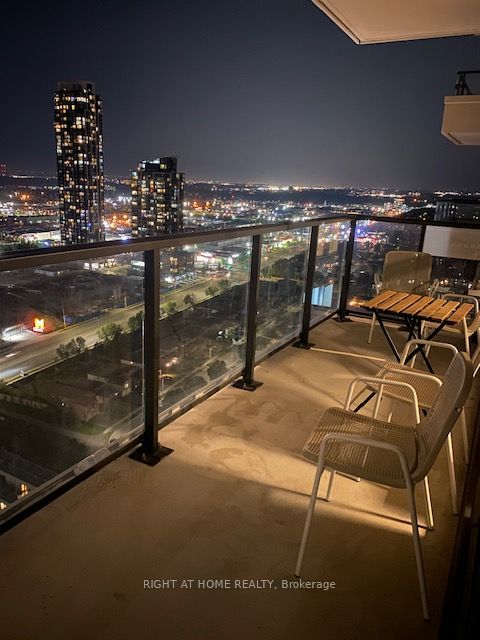
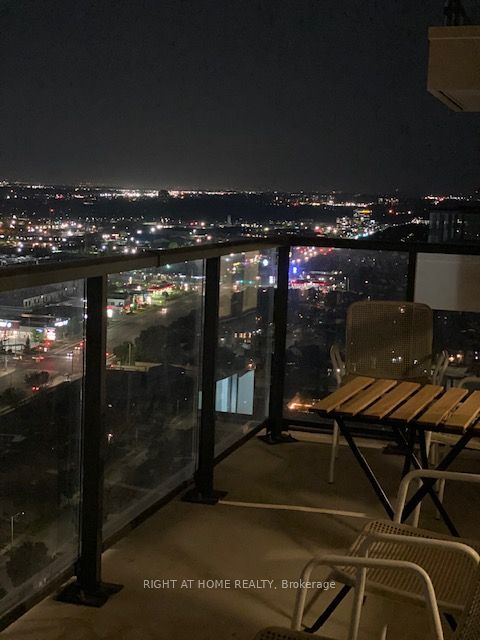
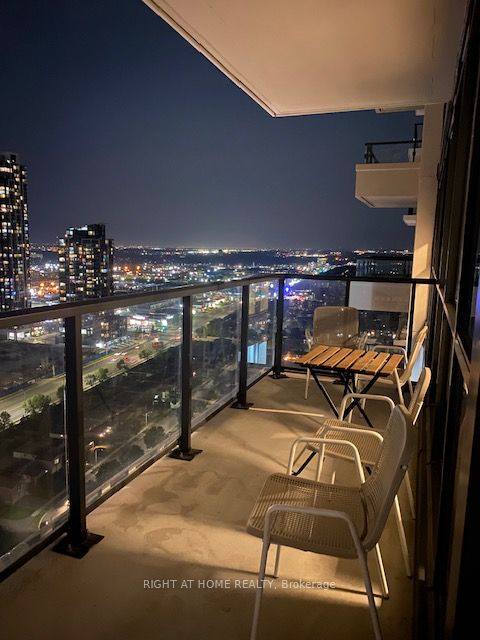
Furnished *Brand New** + 9 Feet Ceilings,(or unfurnished) Unit Features A Massive Outdoor L-Shaped Balcony, Spacious Open Concept W/ Laminate Flooring Throughout Living/Dining. Open Concept Den Overlooking Large Kitchen W/ Stainless Steel Appliances, Breakfast Bar, Granite Countertops & Upgraded Full Glass Cabinets. Just Steps Away From Square One, Library, Ymca, City Hall, Living Arts Center, Sheridan College & More.
Furnished *Brand New** + 9 Feet Ceilings,(or unfurnished) Unit Features A Massive Outdoor L-Shaped Balcony, Spacious Open Concept W/ Laminate Flooring Throughout Living/Dining. Open Concept Den Overlooking Large Kitchen W/ Stainless Steel Appliances, Breakfast Bar, Granite Countertops & Upgraded Full Glass Cabinets. Just Steps Away From Square One, Library, Ymca, City Hall, Living Arts Center, Sheridan College & More.
See MoreKey Info
- Apartment Condo
- 1 Parking
- Burnhamthorpe & Confederation
- 700-799 Approximate Sq Feet
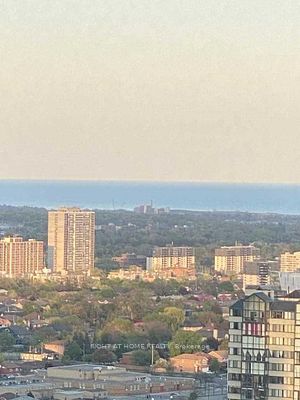
- South-East Exposure
- Ensuite Laundry
- Owned Locker
- Forced Air Gas Heating
- Central Air
Property
- Includes: Common Elements, Parking.
- Excludes: Heat, Hydro, Water, Cable TV, Central A/C, Building Insurance
- Possession: TBA
Details
- Concrete Exterior
- No Fireplace
- 1 Kitchen
- Designation: Other
- Condo Corporation #1089
- Condo Registry Office: PSCP
- MLS #W12167989
- RIGHT AT HOME REALTY
Extras
Rooms
| Room | Floor | Dimensions | Details | |
|---|---|---|---|---|
 | 2 4-Piece Bathrooms | |||
Who lives here?
Creditview, Mississauga is a west GTA neighbourhood notable for its singles, renters, university grads and science professionals. It has a higher than average population of immigrants, particularly those from China and the Philippines, and Arabic and Mandarin speakers. Residents tend to be younger with a significant number of youth aged 20 to 24, adults aged 25 to 39 and seniors aged 65 to 69.
Families
Kids Per Family
1.2
kids per family
in the neighbourhood.
Gta ({{ '1.29999995231628' | number: 1 }})
Singles
45%
of residents are
single and loving it.
45% singles
Mississauga (44%)Gta ({{ '44.8800010681152' | number: 0 }}%)
Renters
36%
of residents
are renters.
36% renters
Mississauga (29%)Gta ({{ '33.0200004577637' | number: 0 }}%)
Education
49%
of residents are
university grads.
49% university grads
Mississauga (45%)Gta ({{ '43.6699981689453' | number: 0 }}%)
Income
Average Household Income
$105K
is the average household
income in the neighbourhood.
Gta ({{ '135056.828125' | minifiedCurrency }})
Professions
Professions
| Sales | 14% |
| Business | 11% |
| Sciences | 9% |
| Management | 7% |
| Trades | 7% |
Immigrants
59%
of residents were
born outside of Canada.
59% immigrants
Mississauga (56%)Gta ({{ '45.4300003051758' | number: 0 }}%)
Birthplace - All
9.4% from India
All-time
Birthplace - Recent
3.2% from India
Recent
Foreign Languages
Foreign Languages
| Arabic | 7% |
| Mandarin | 7% |
| Cantonese | 4% |
| Tagalog | 4% |
| Urdu | 4% |
Religions
Religions
| Christian | 56% |
| Muslim | 12% |
| Hindu | 7% |
| Sikh | 5% |
| Buddhist | 3% |