$548,000Asking Price
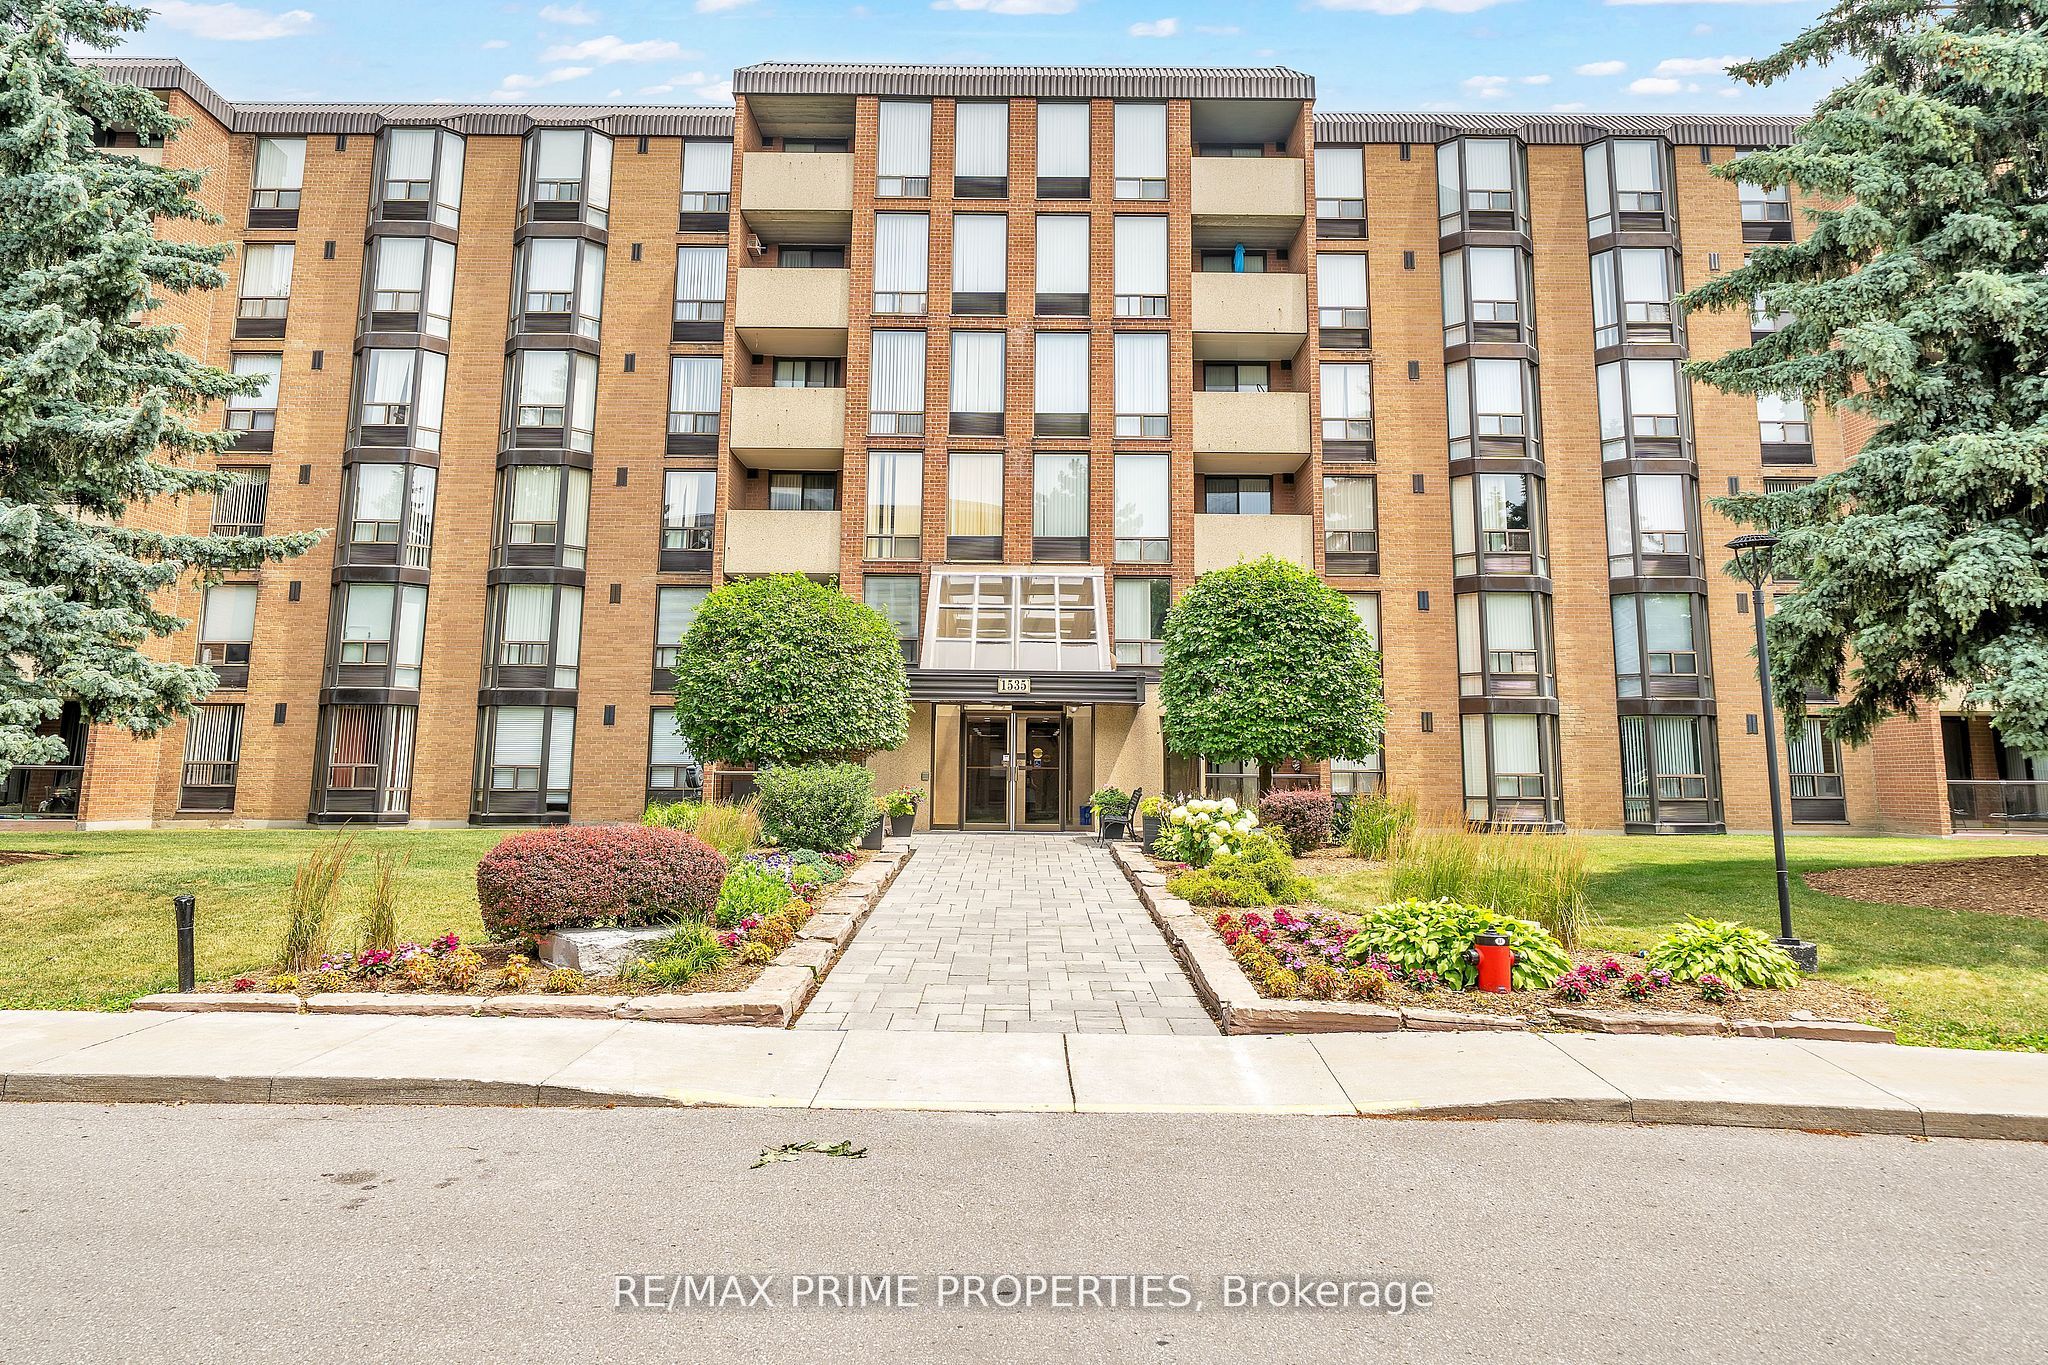
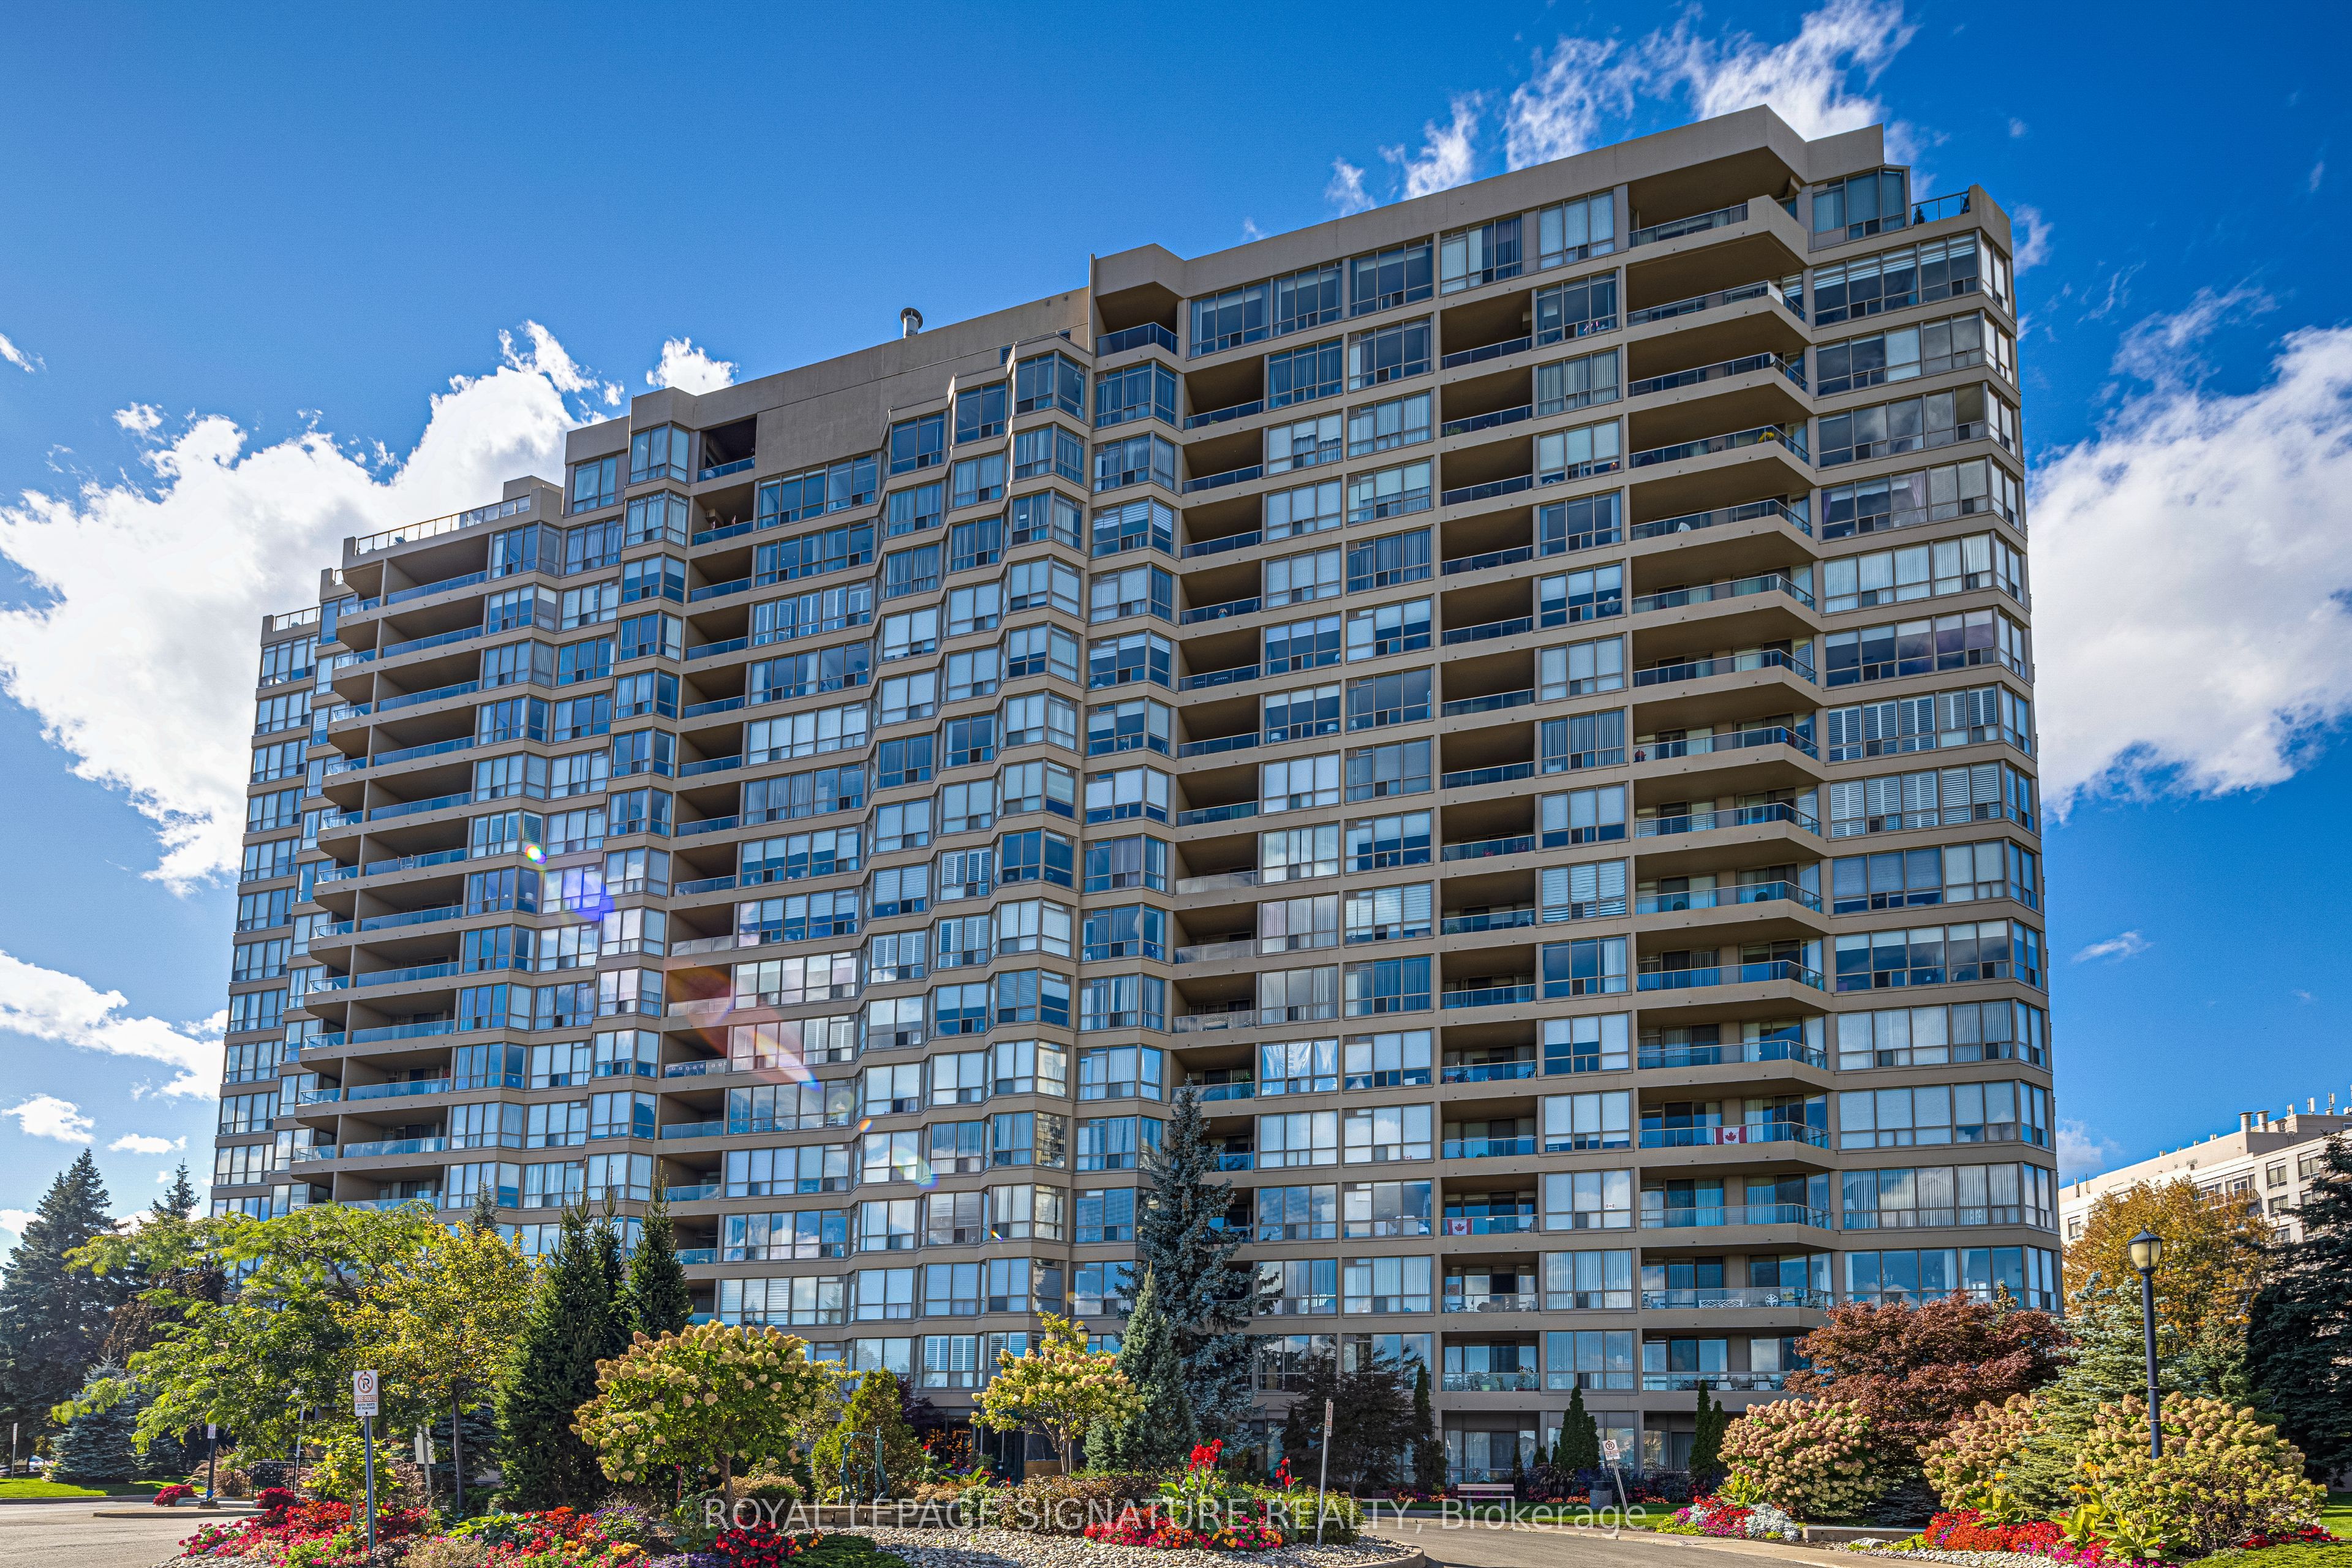
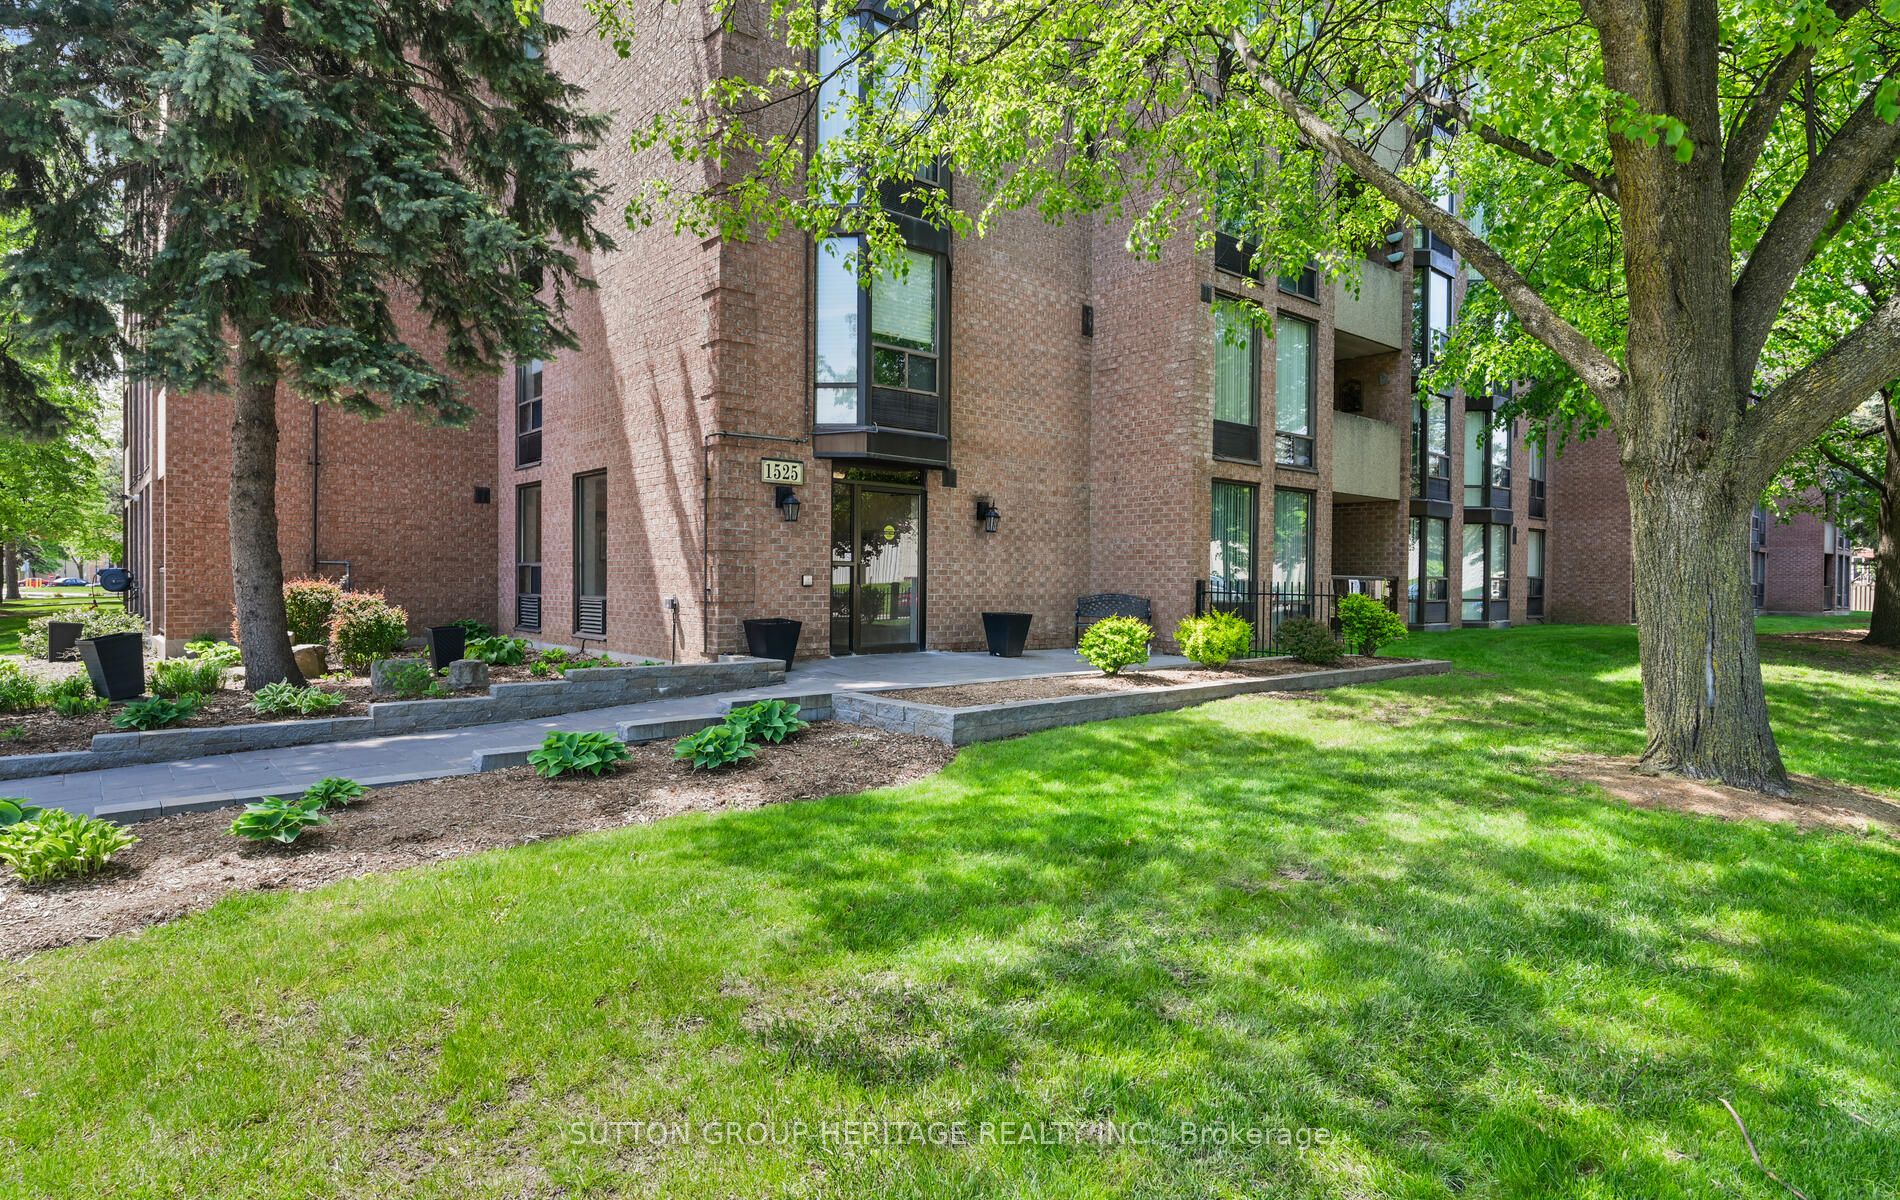
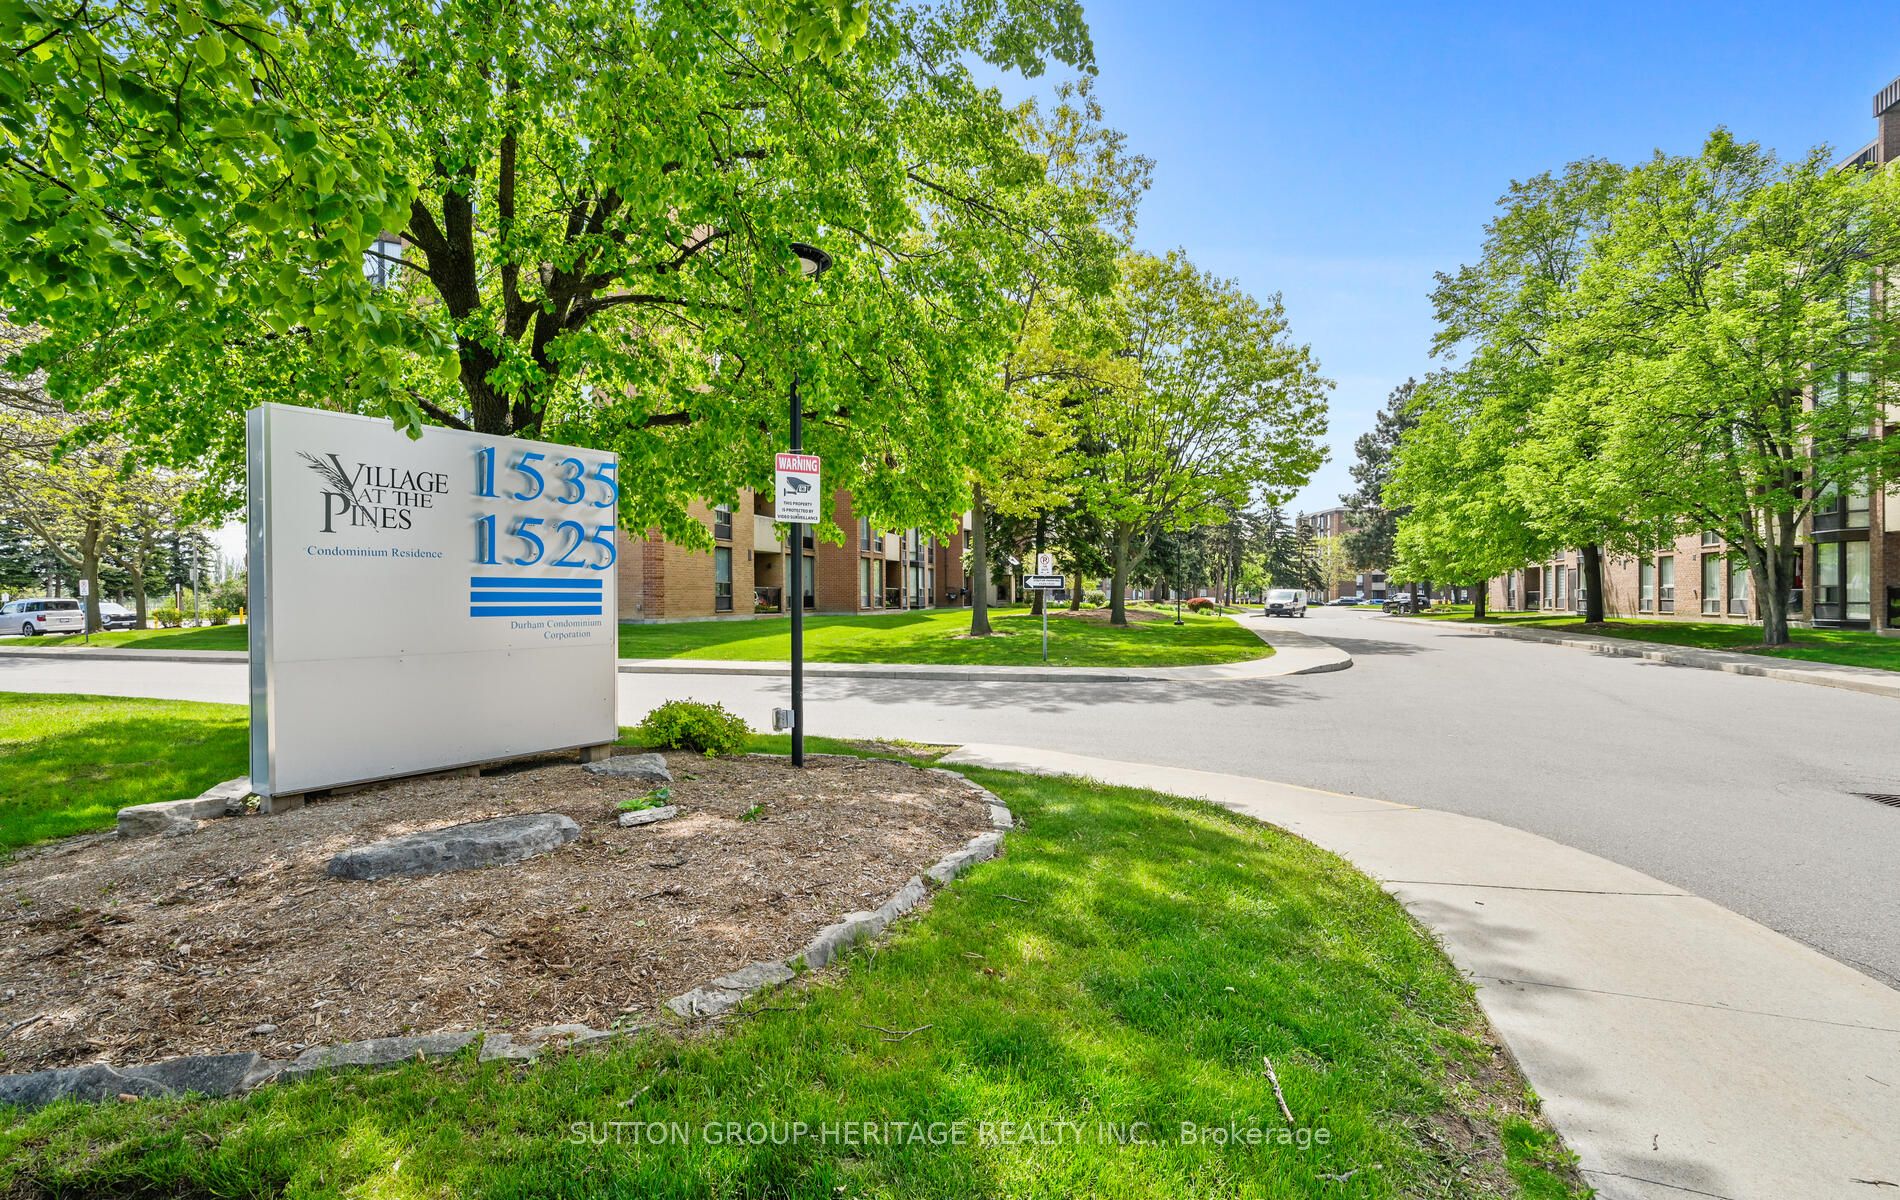
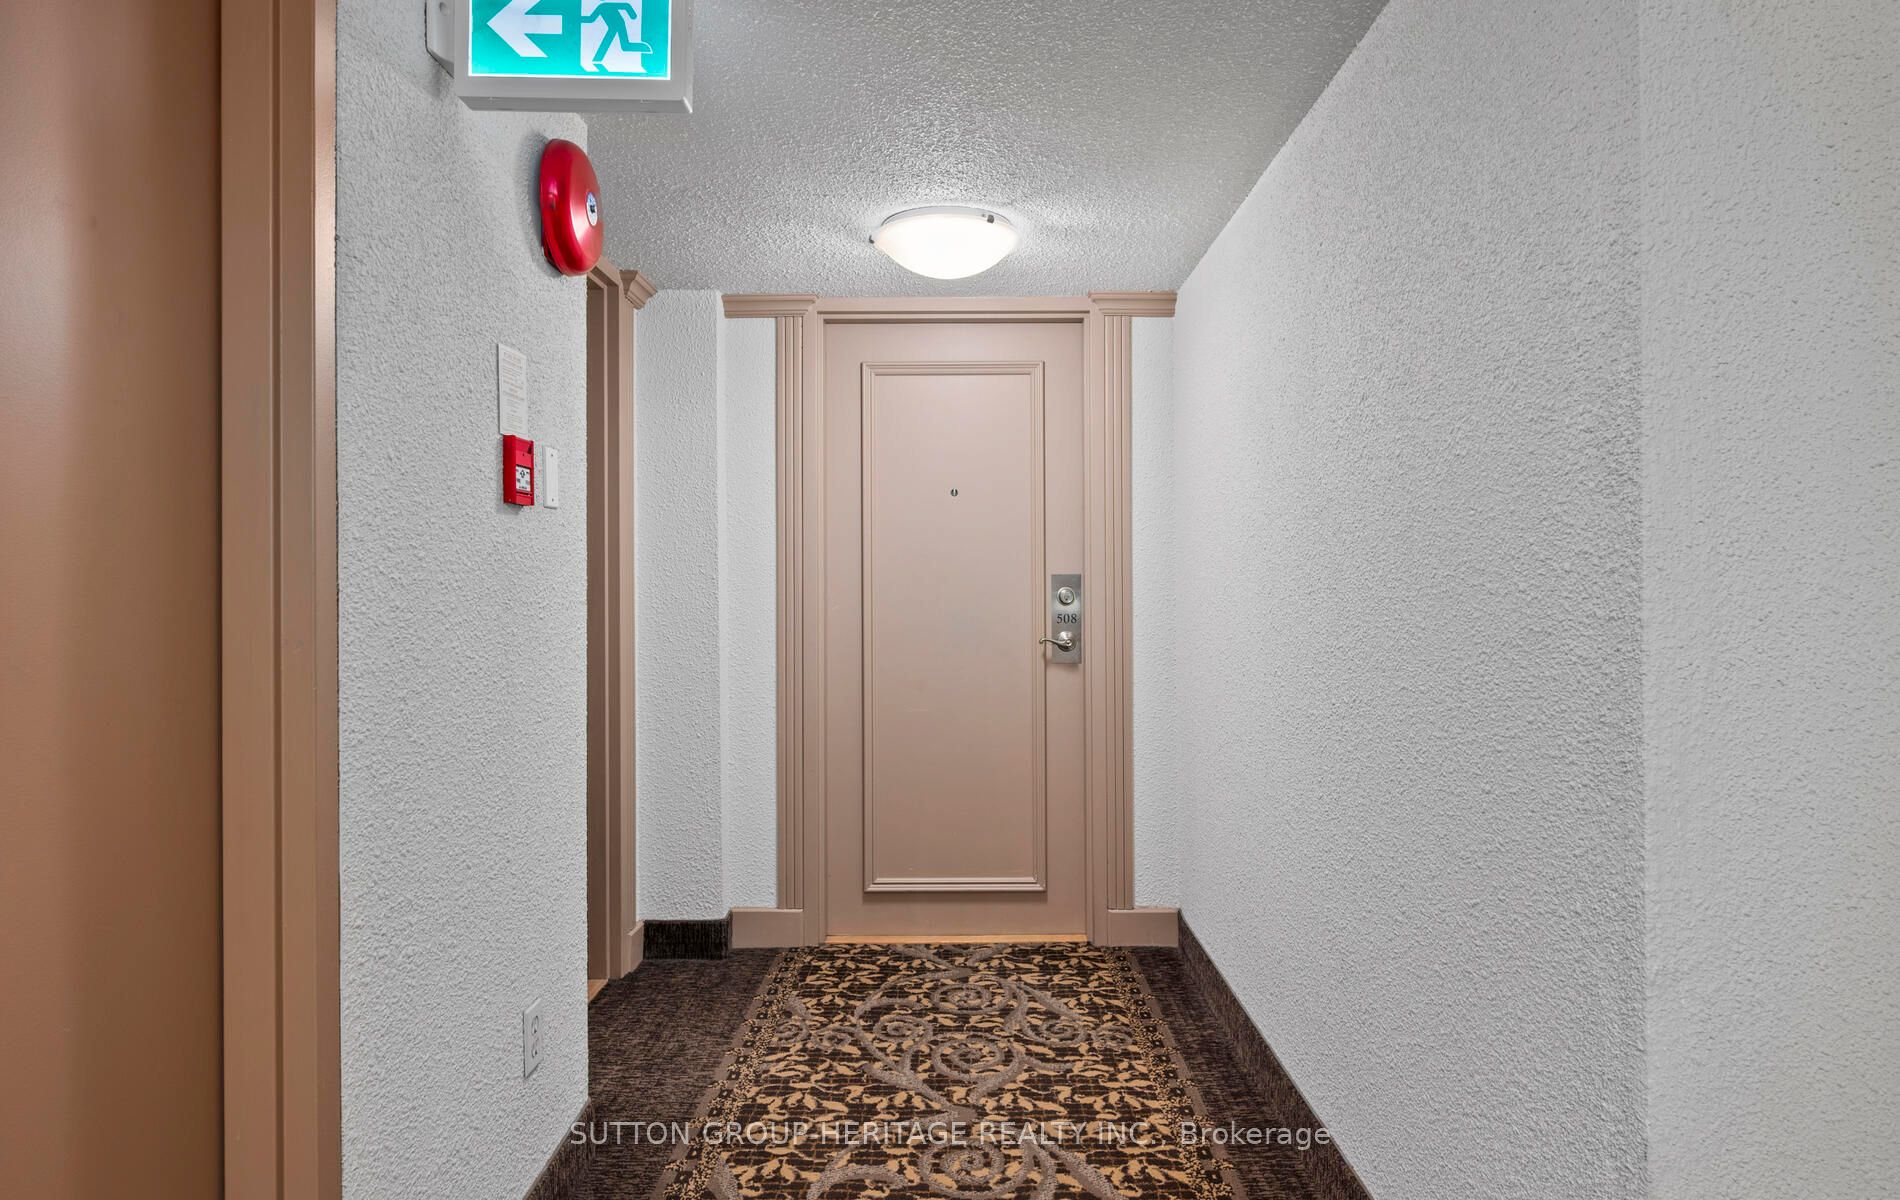
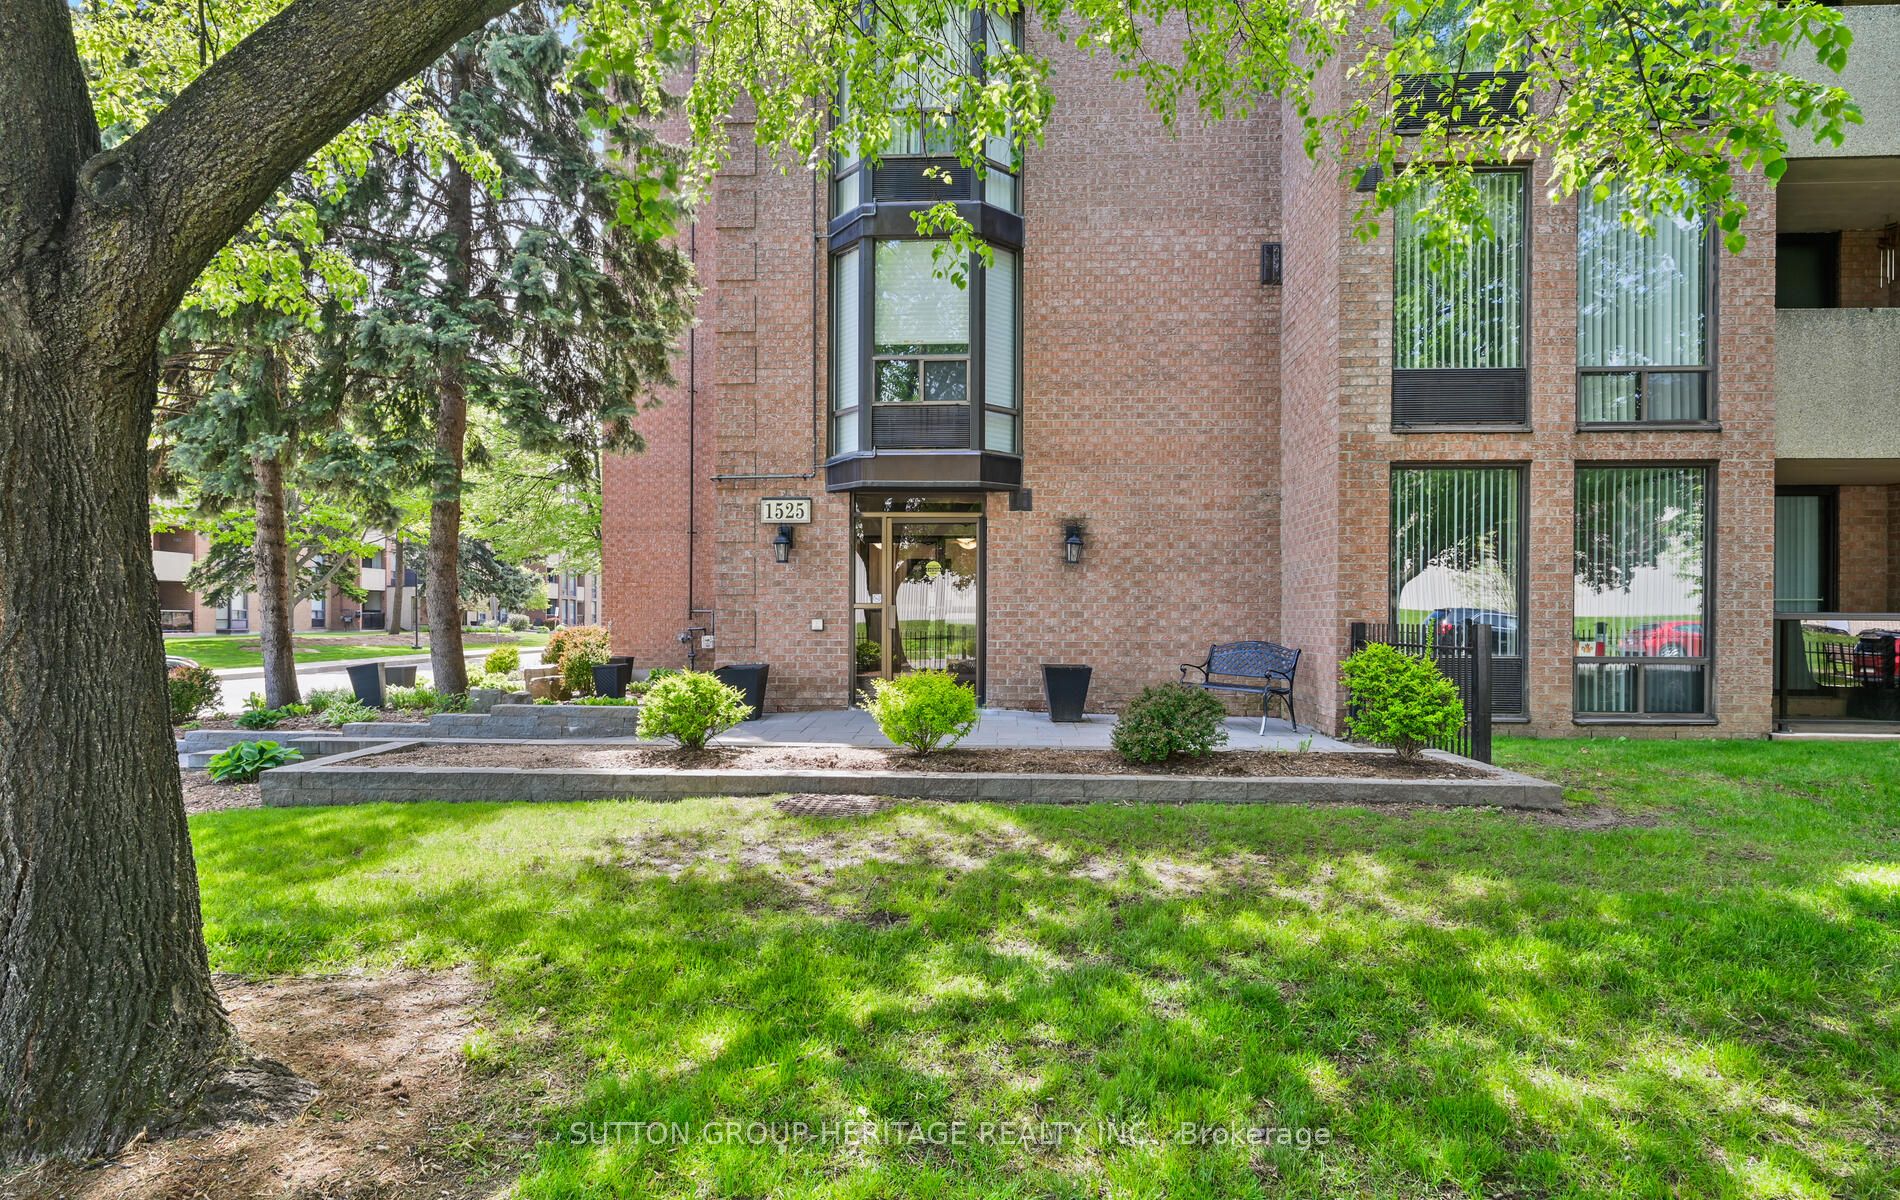
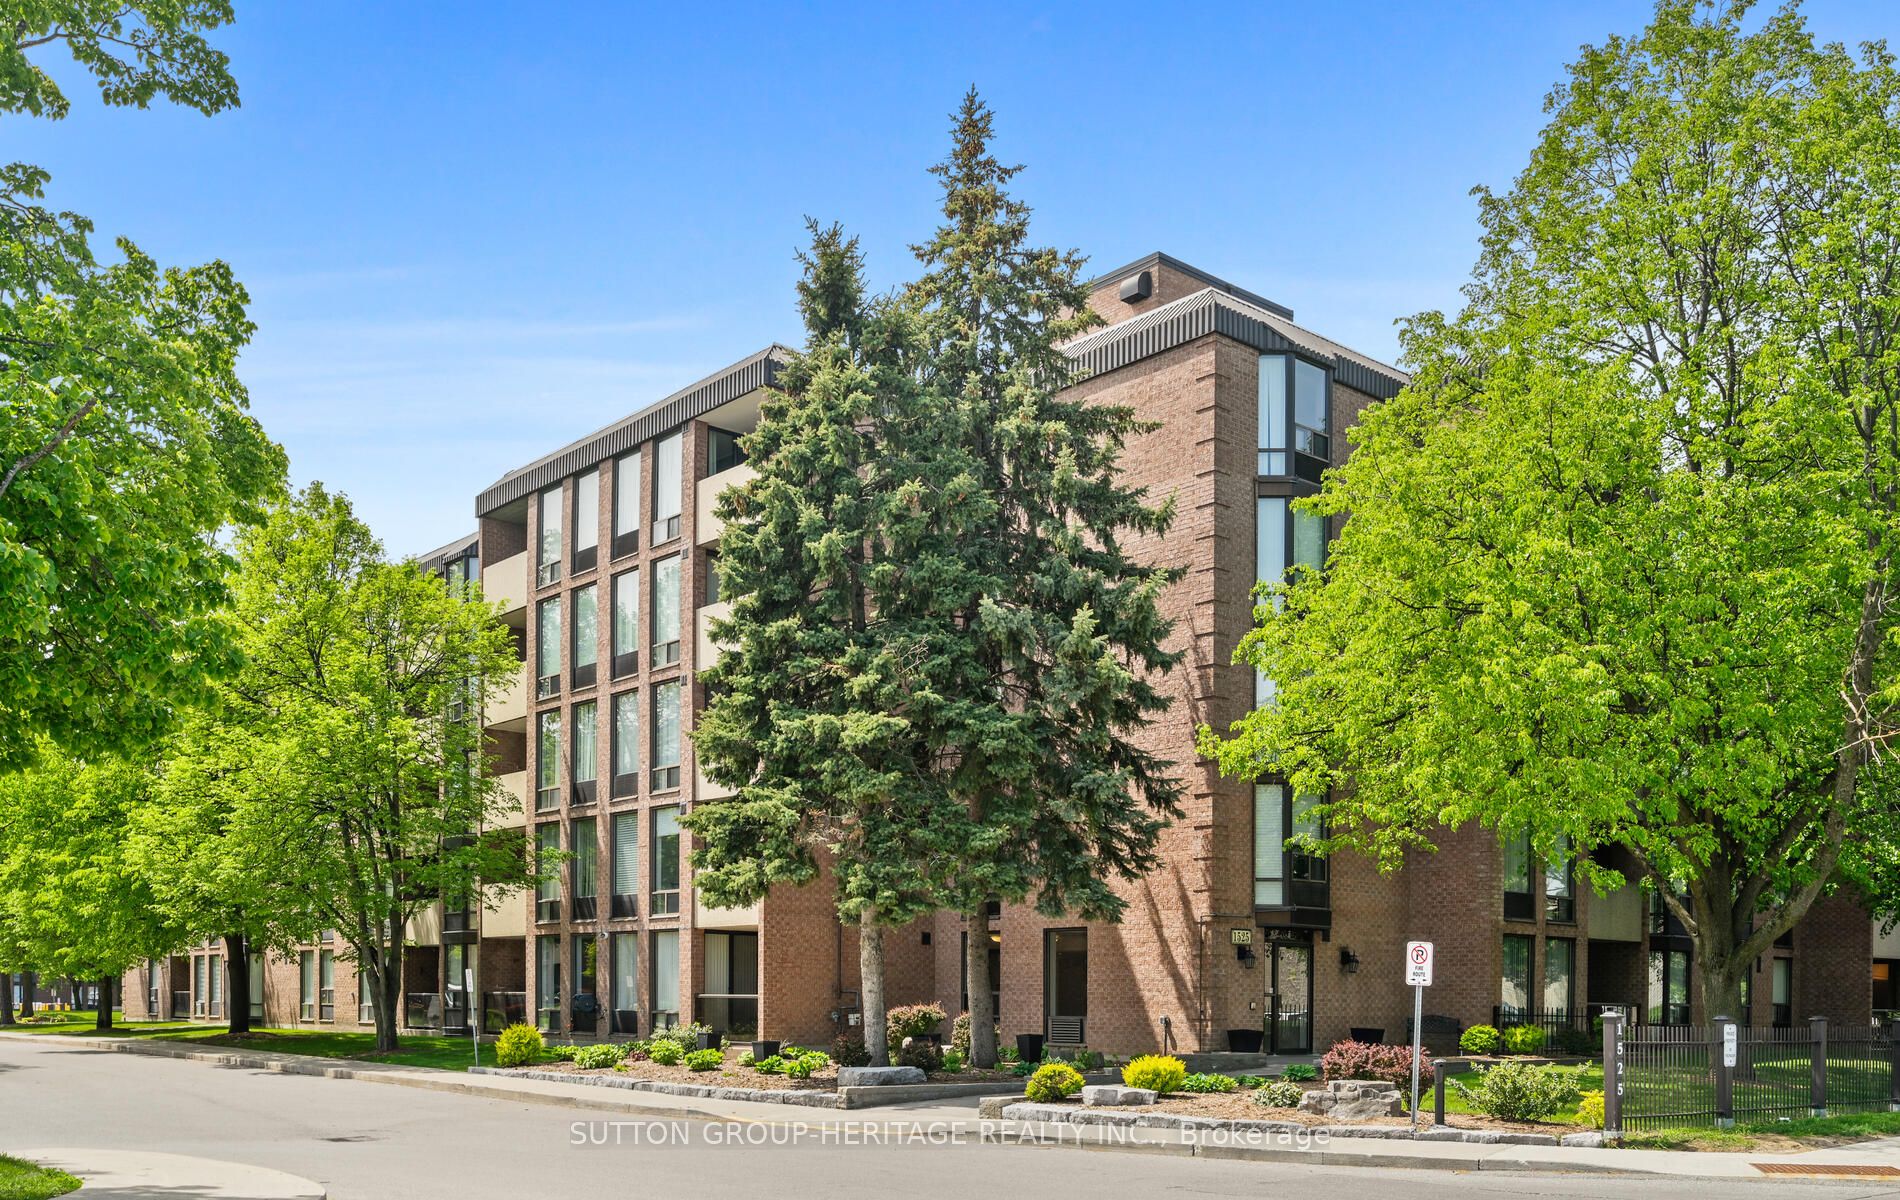
#508 - 1525 Diefenbaker Court, Pickering, ON L1V 3W1 #508
Town Centre, Pickering
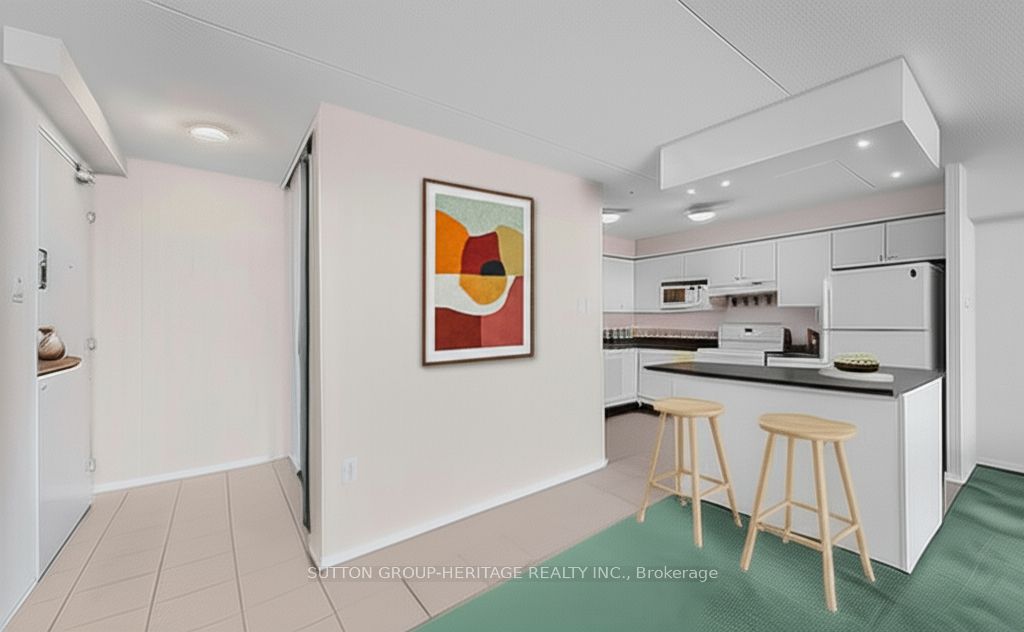
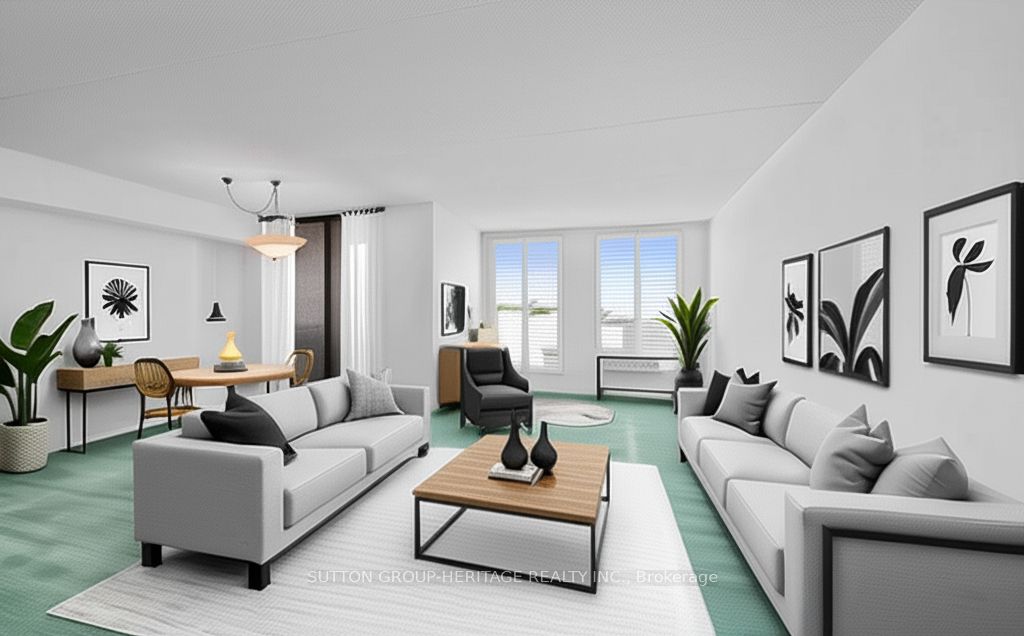
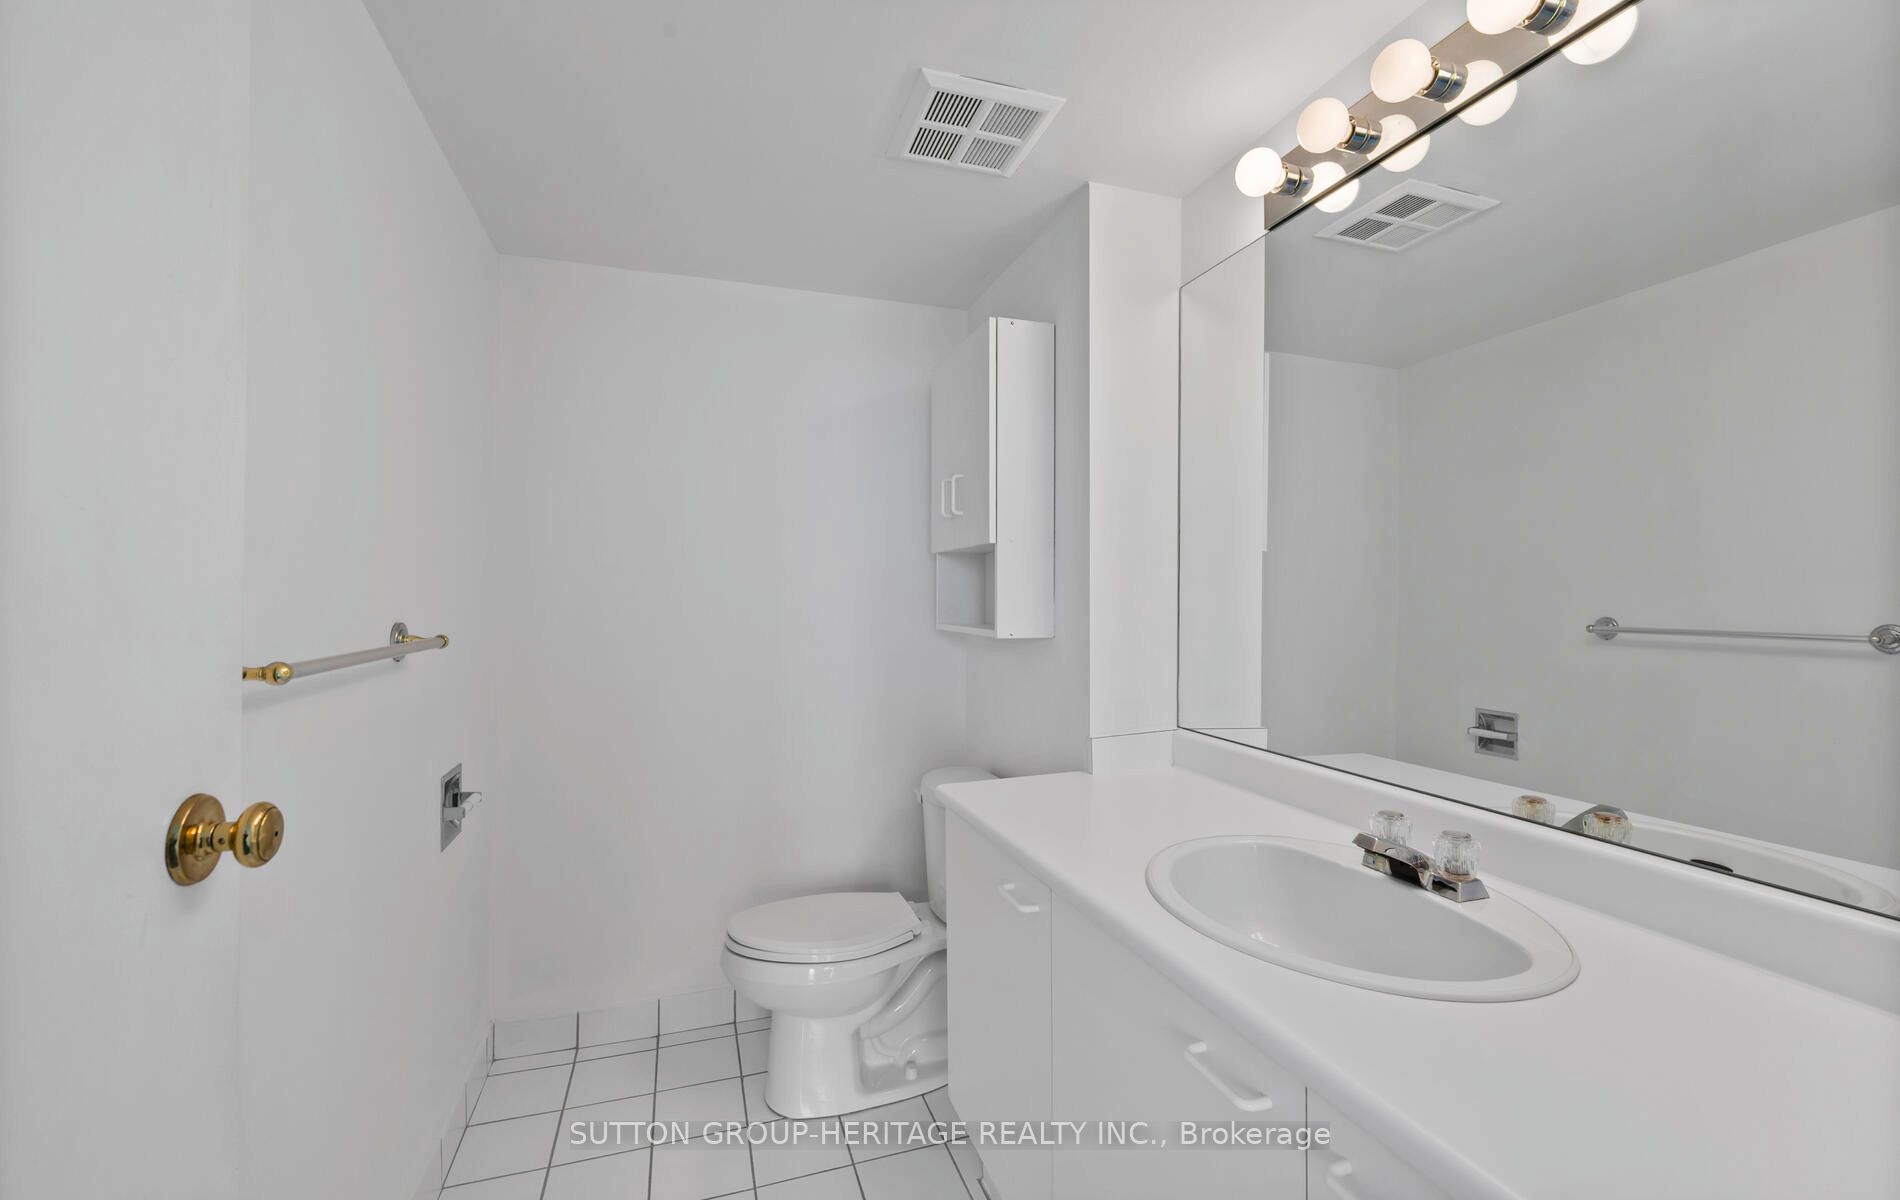
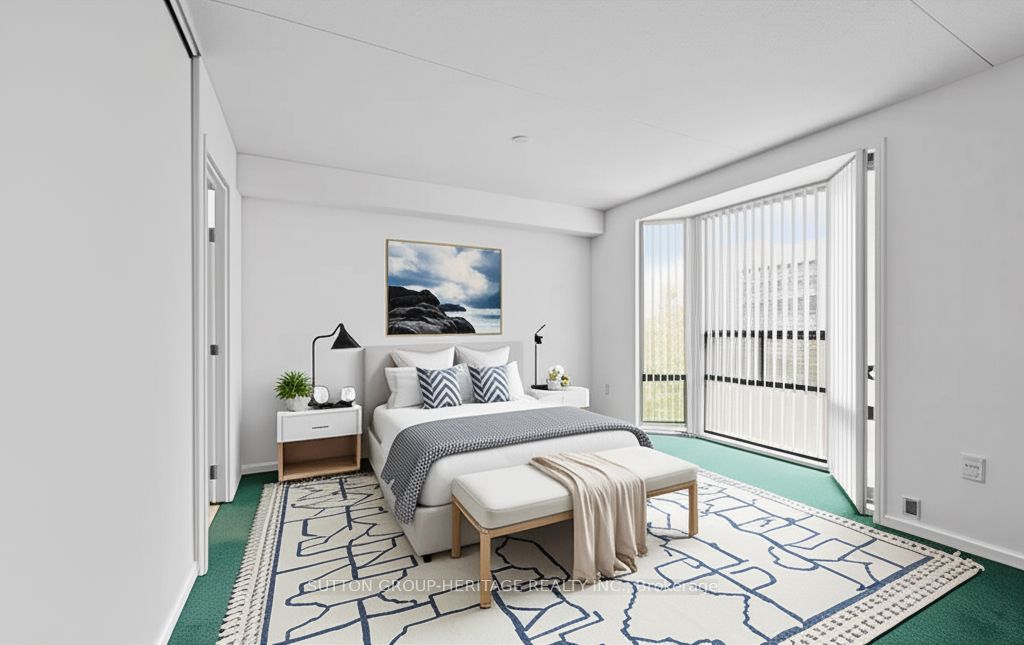
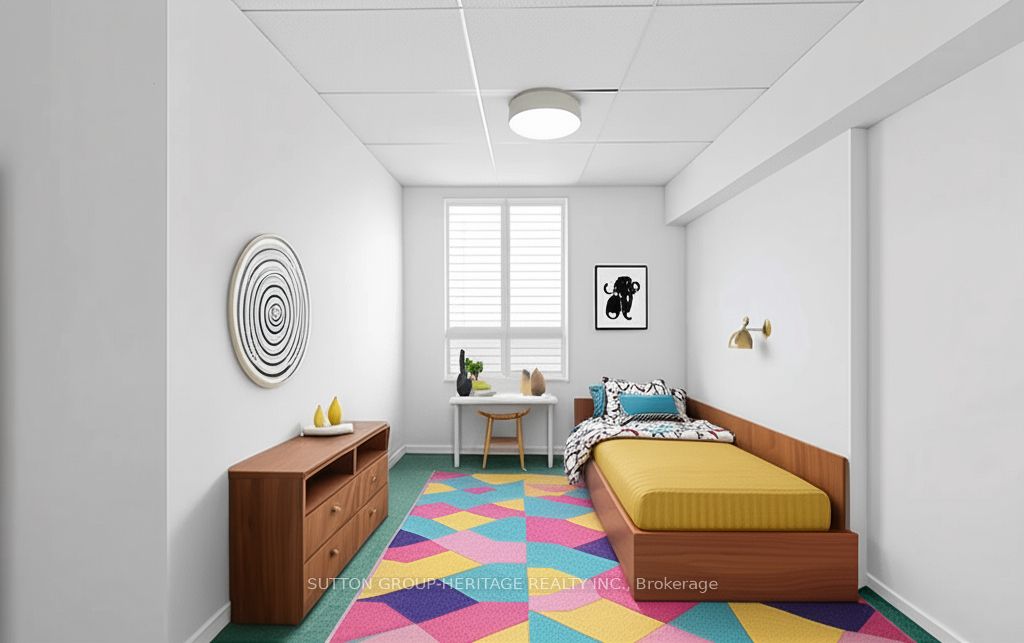
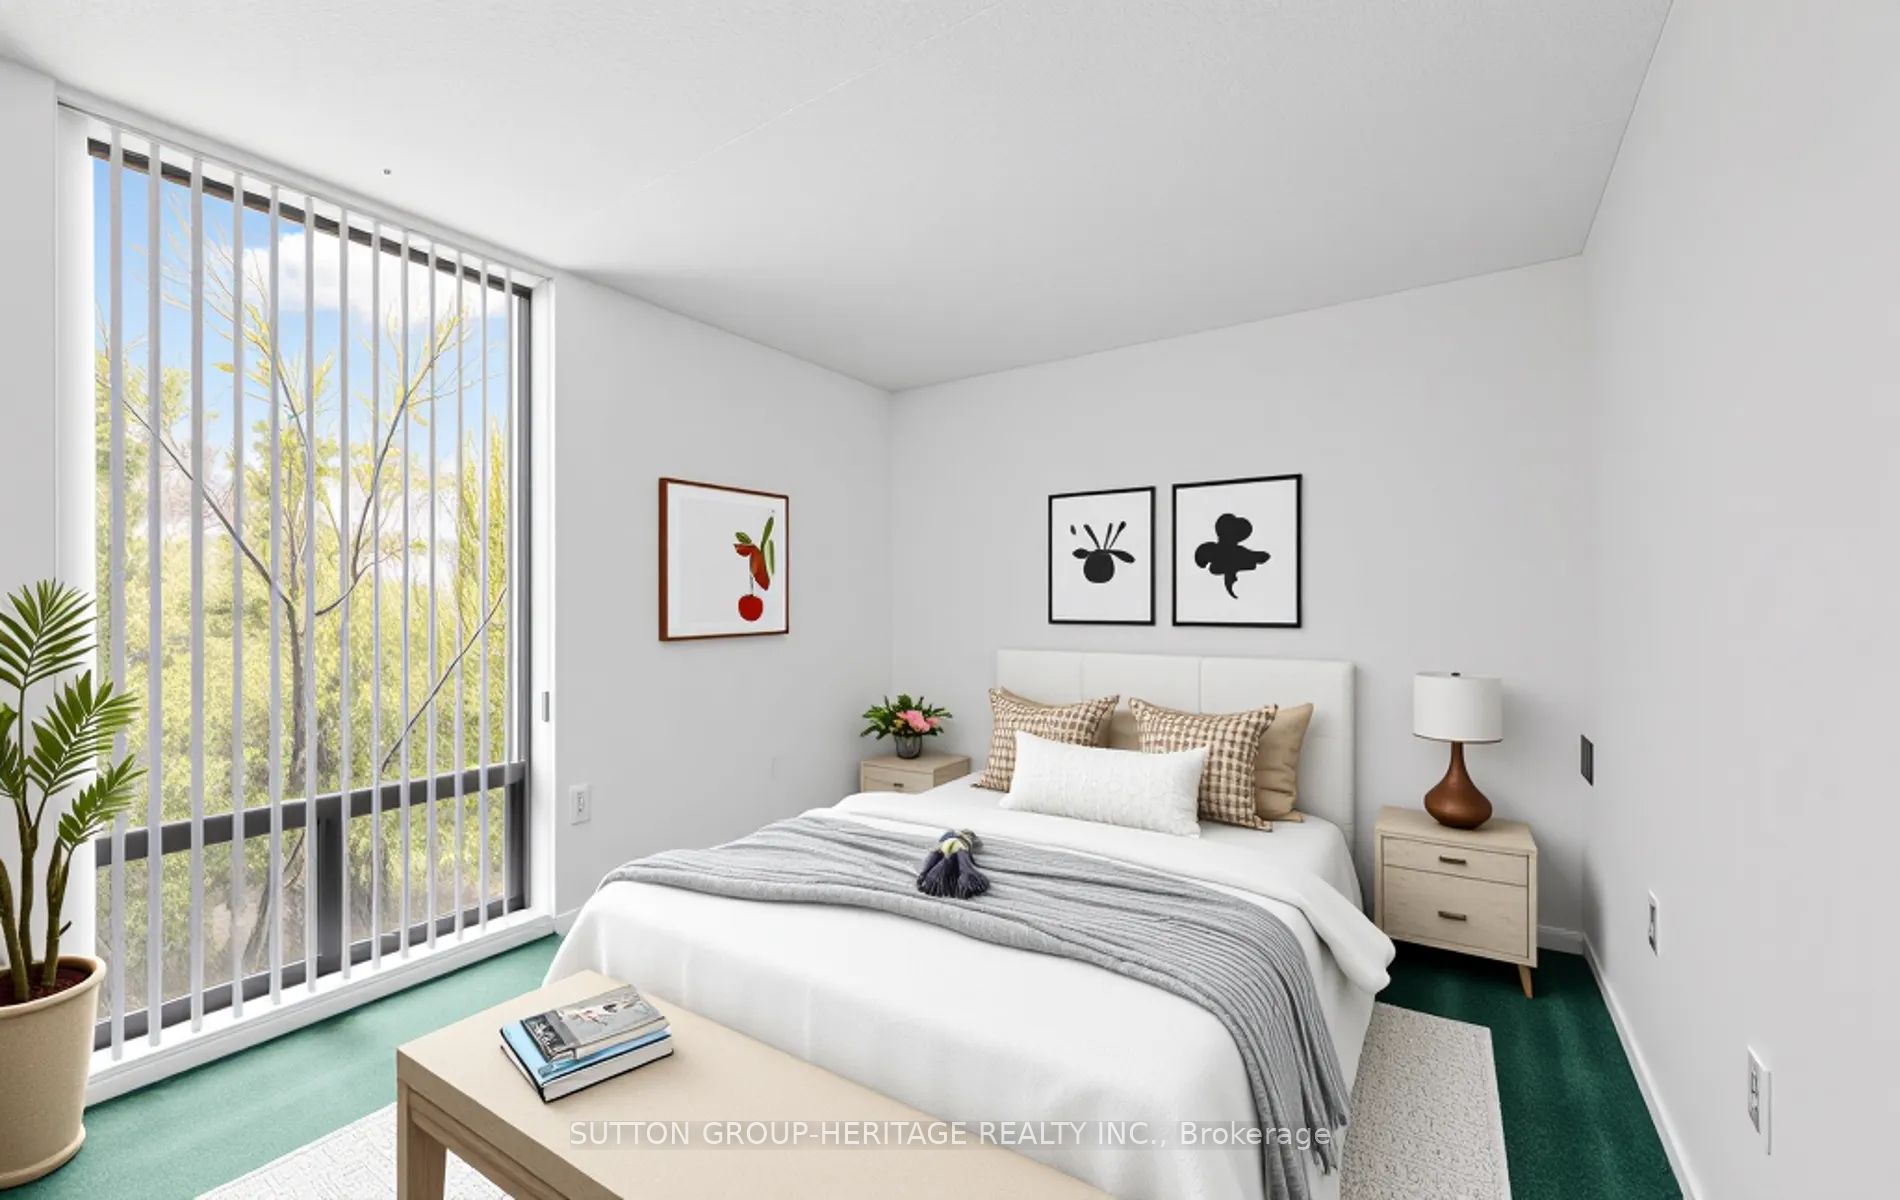
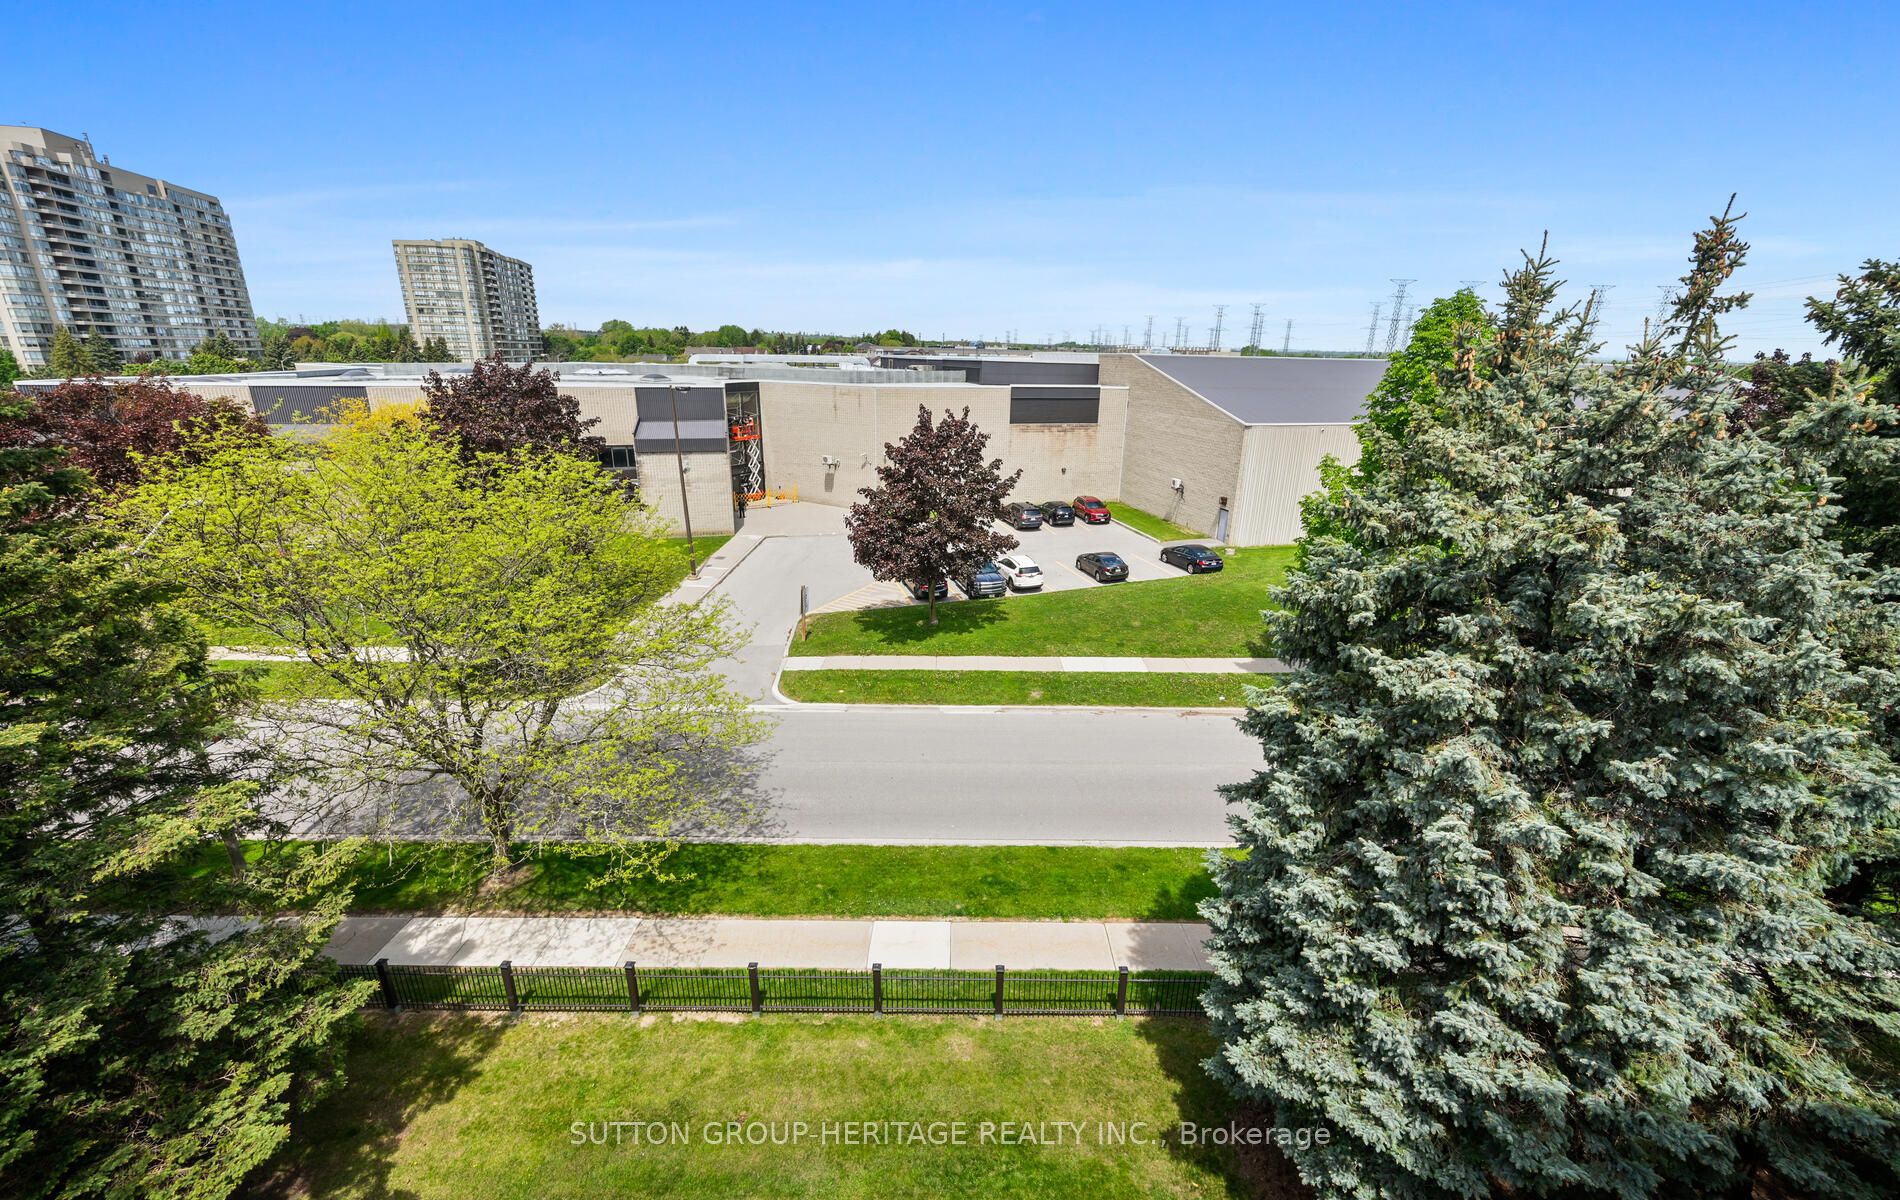
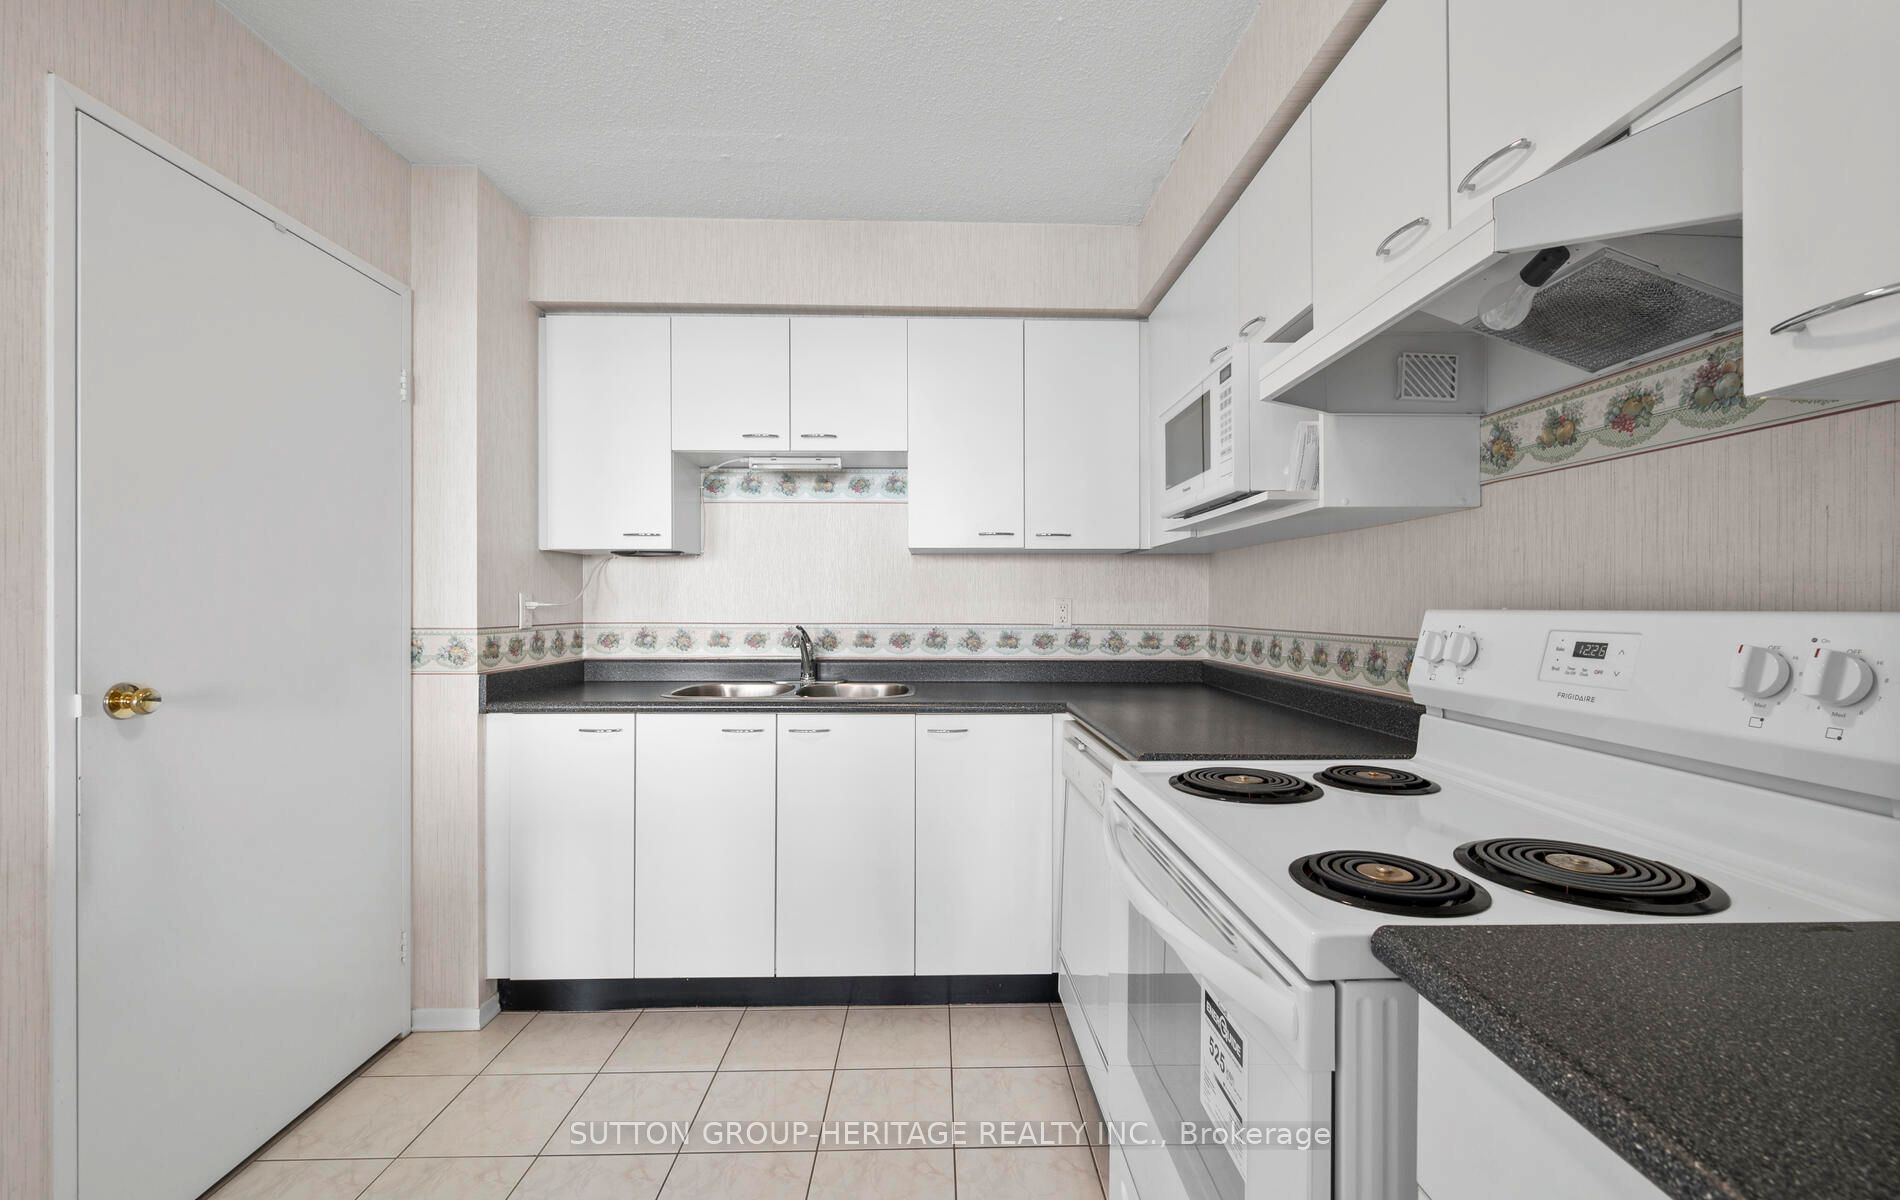
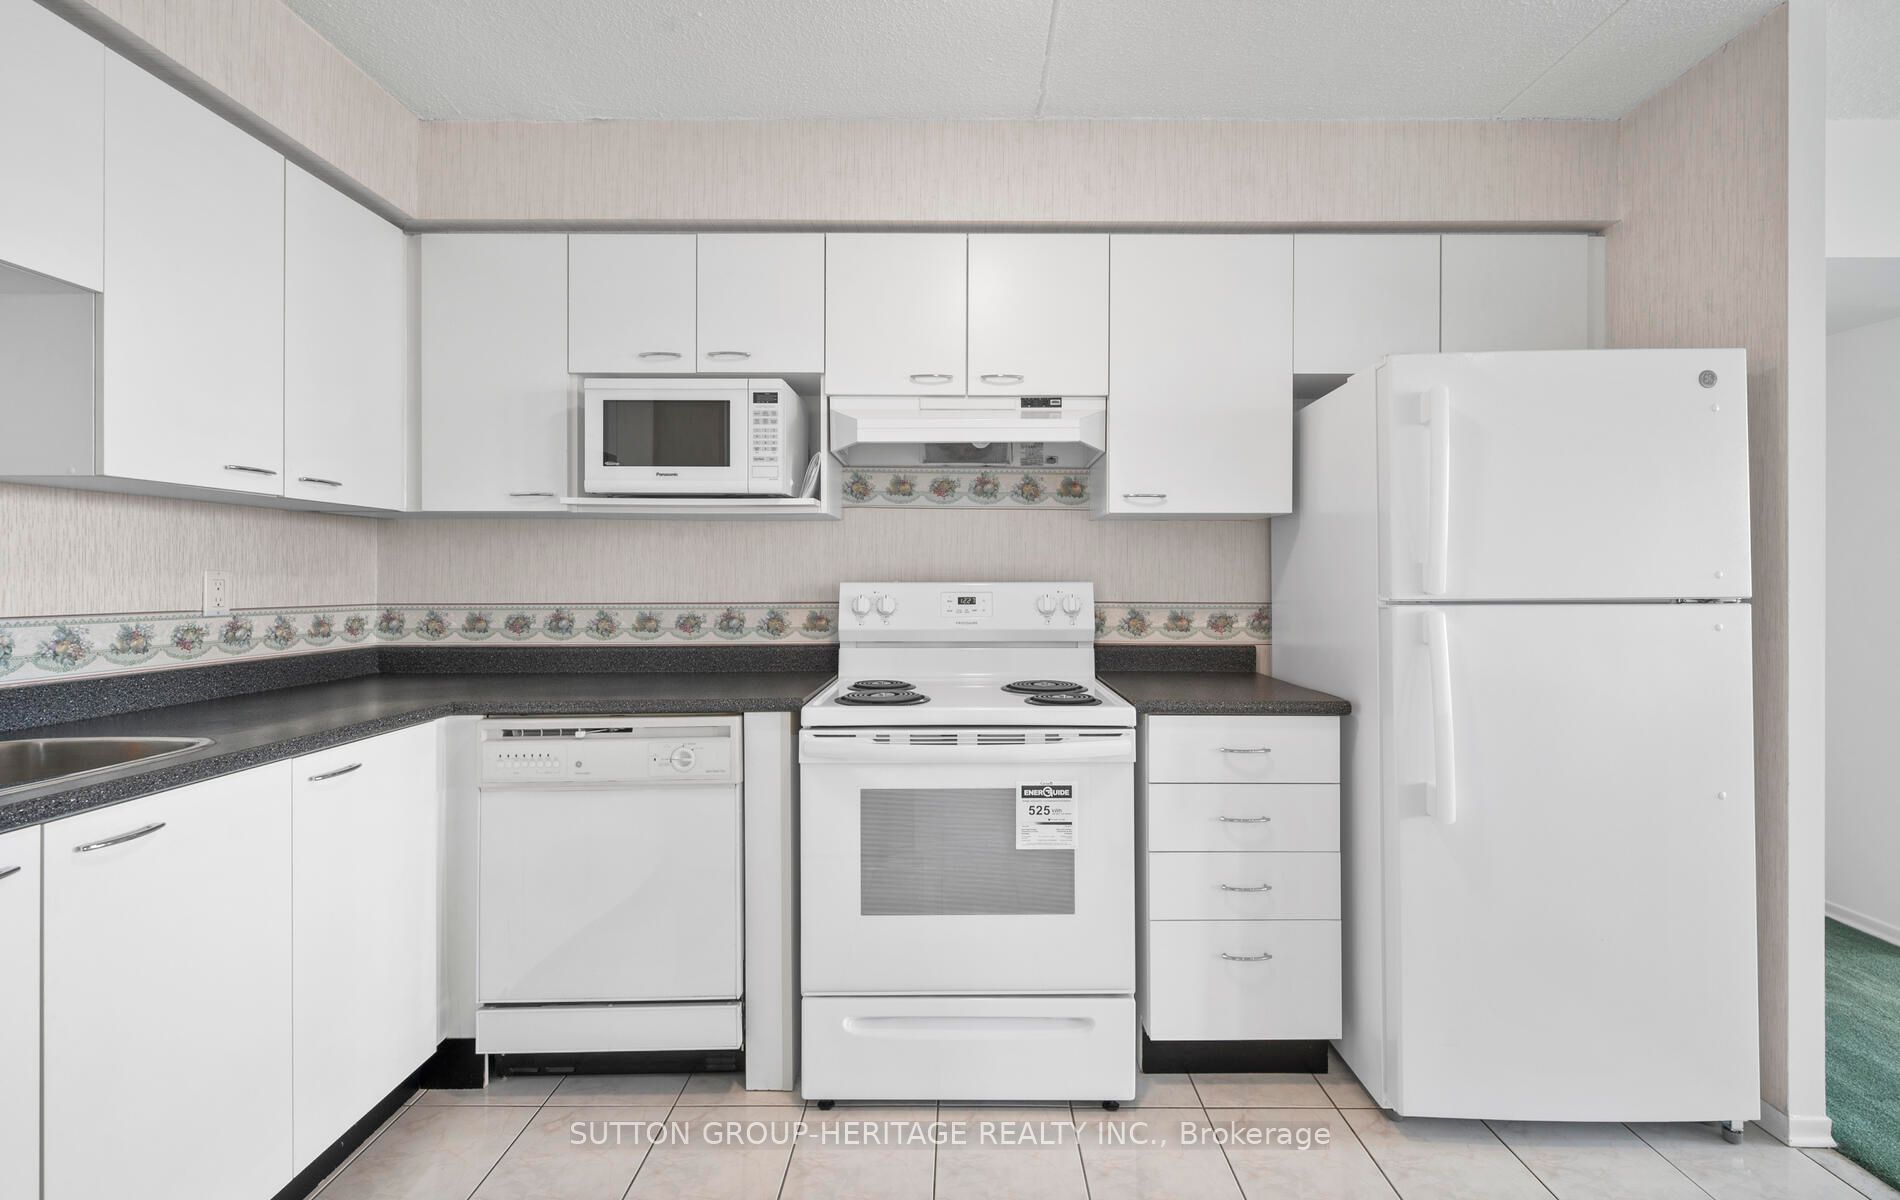
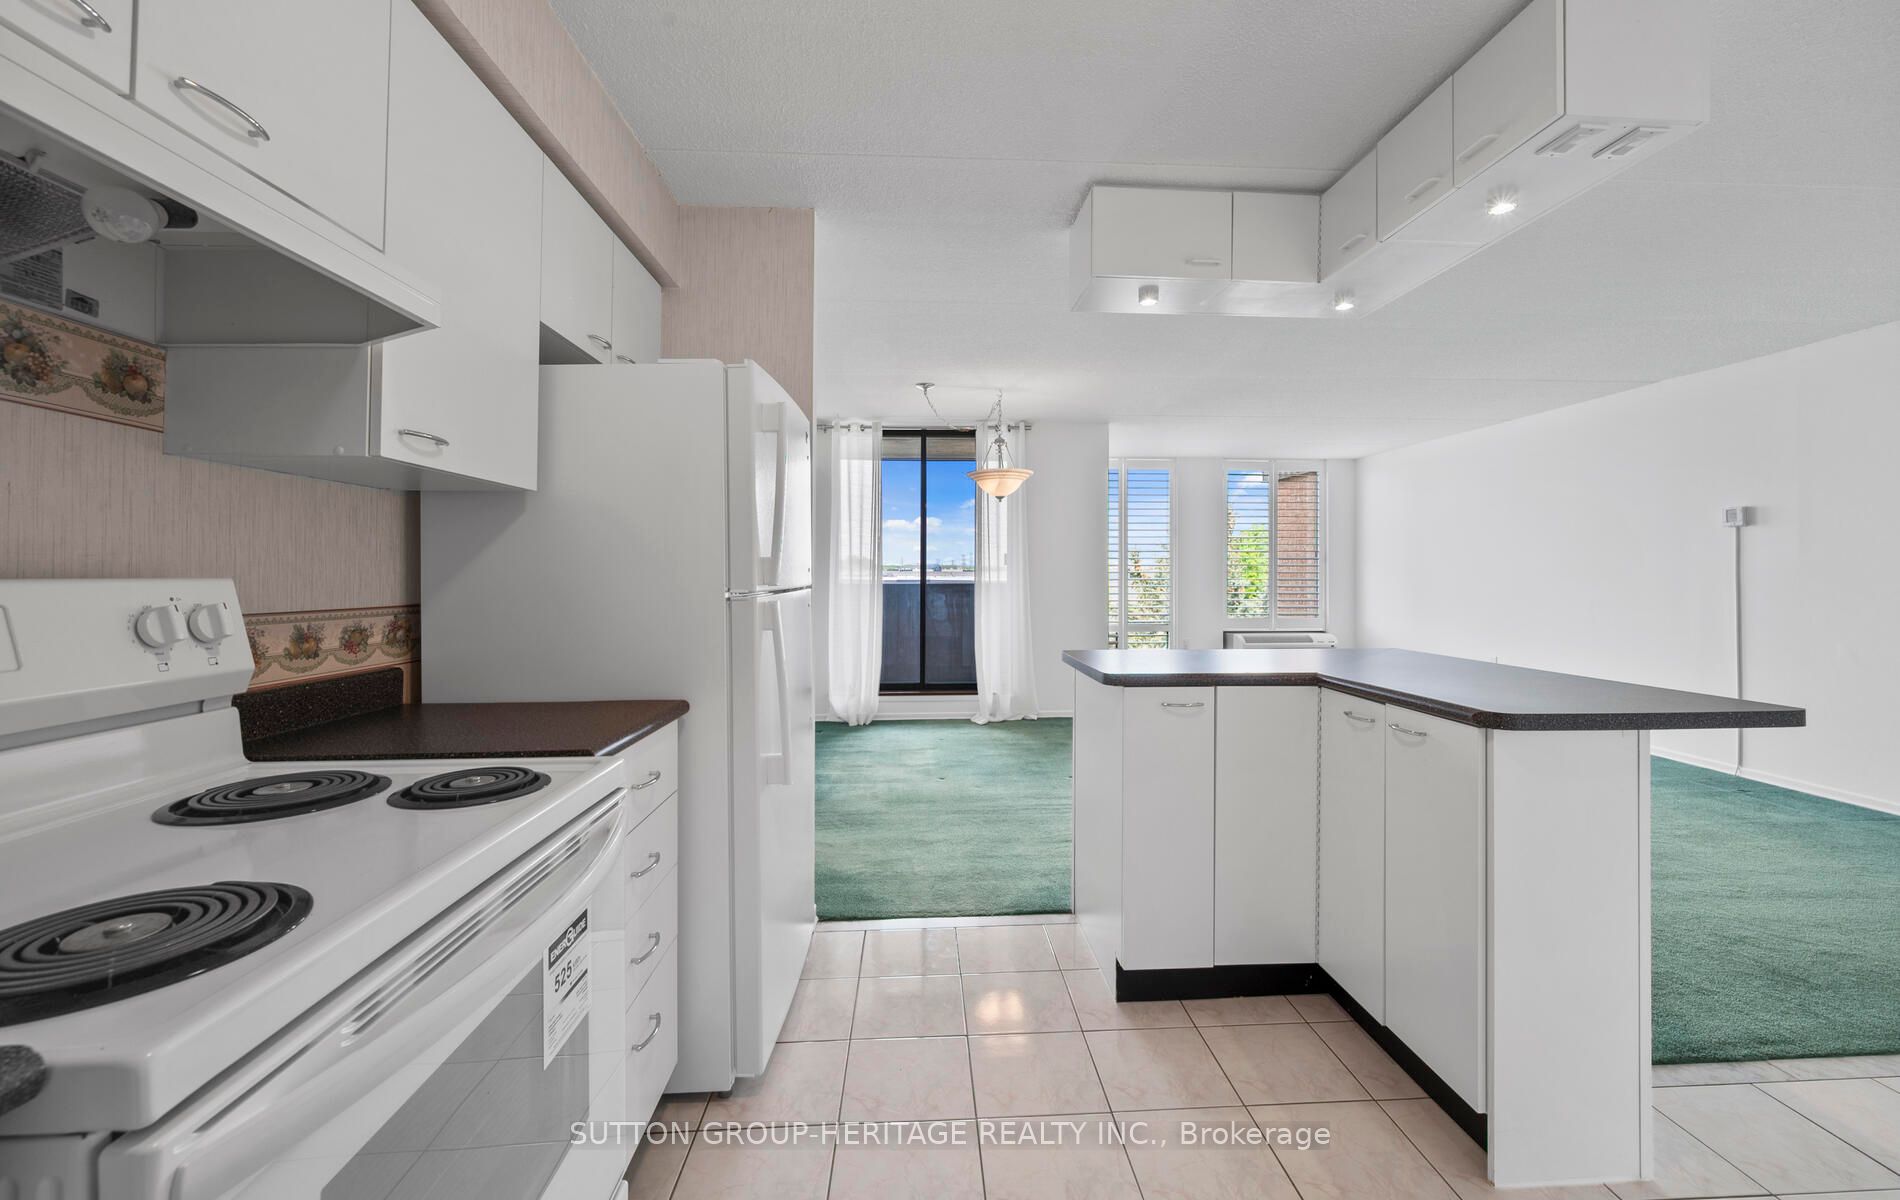
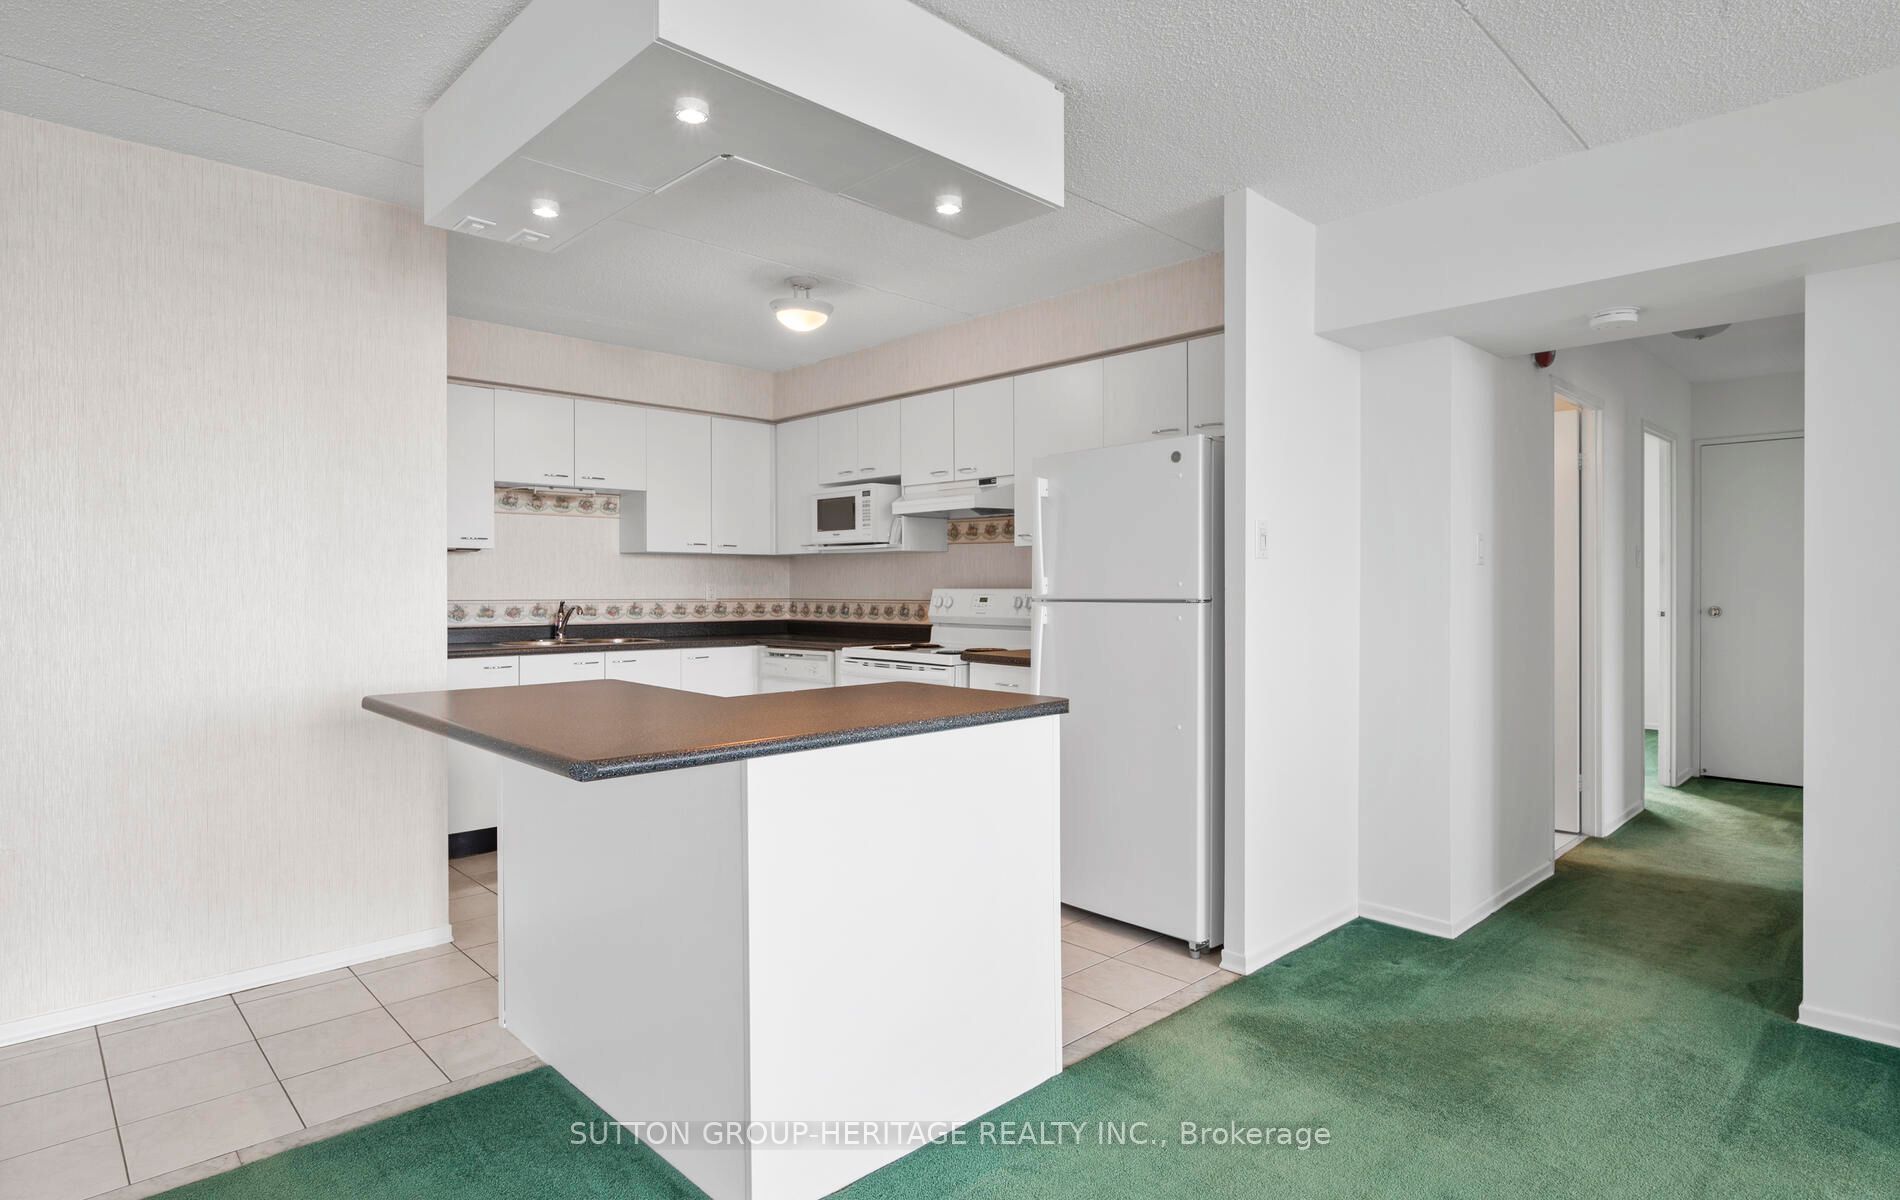
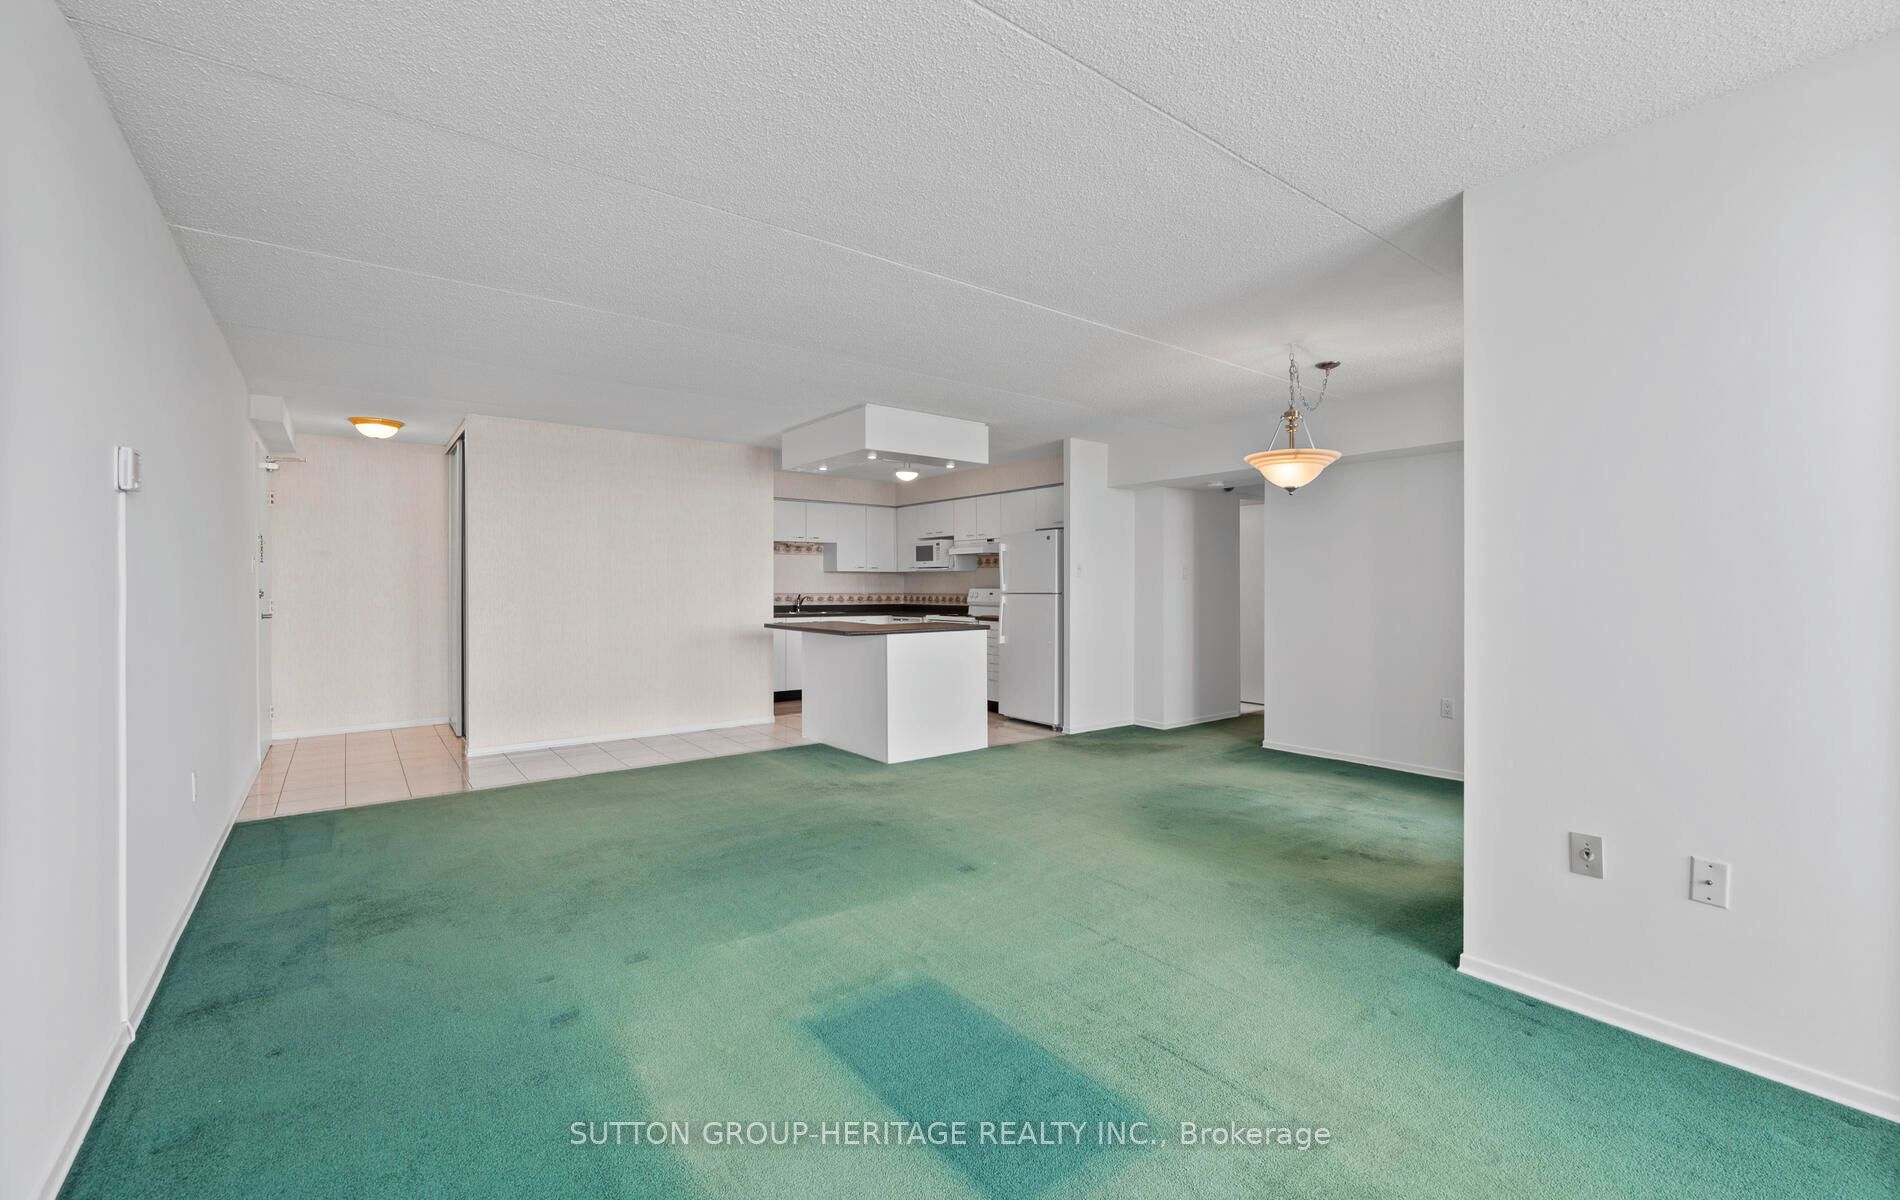
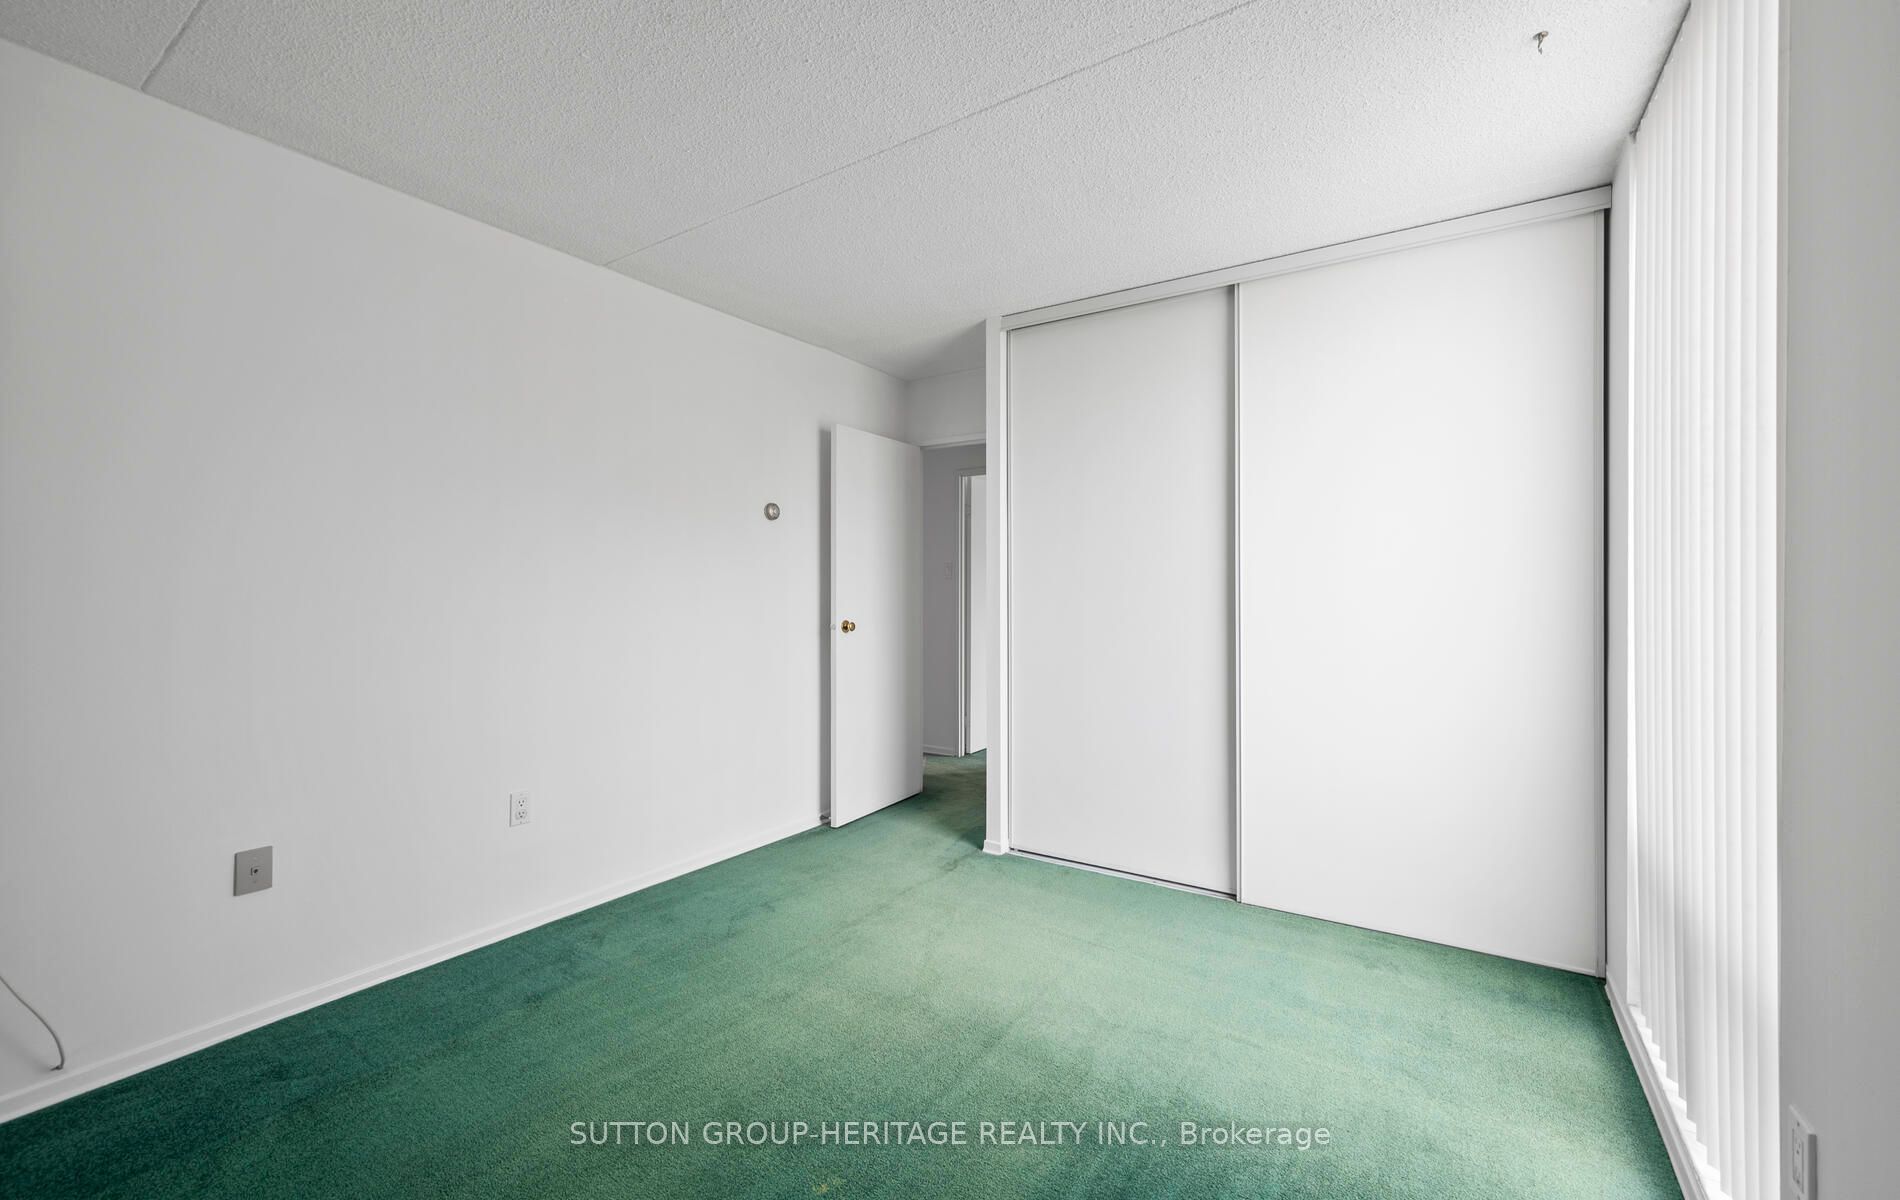
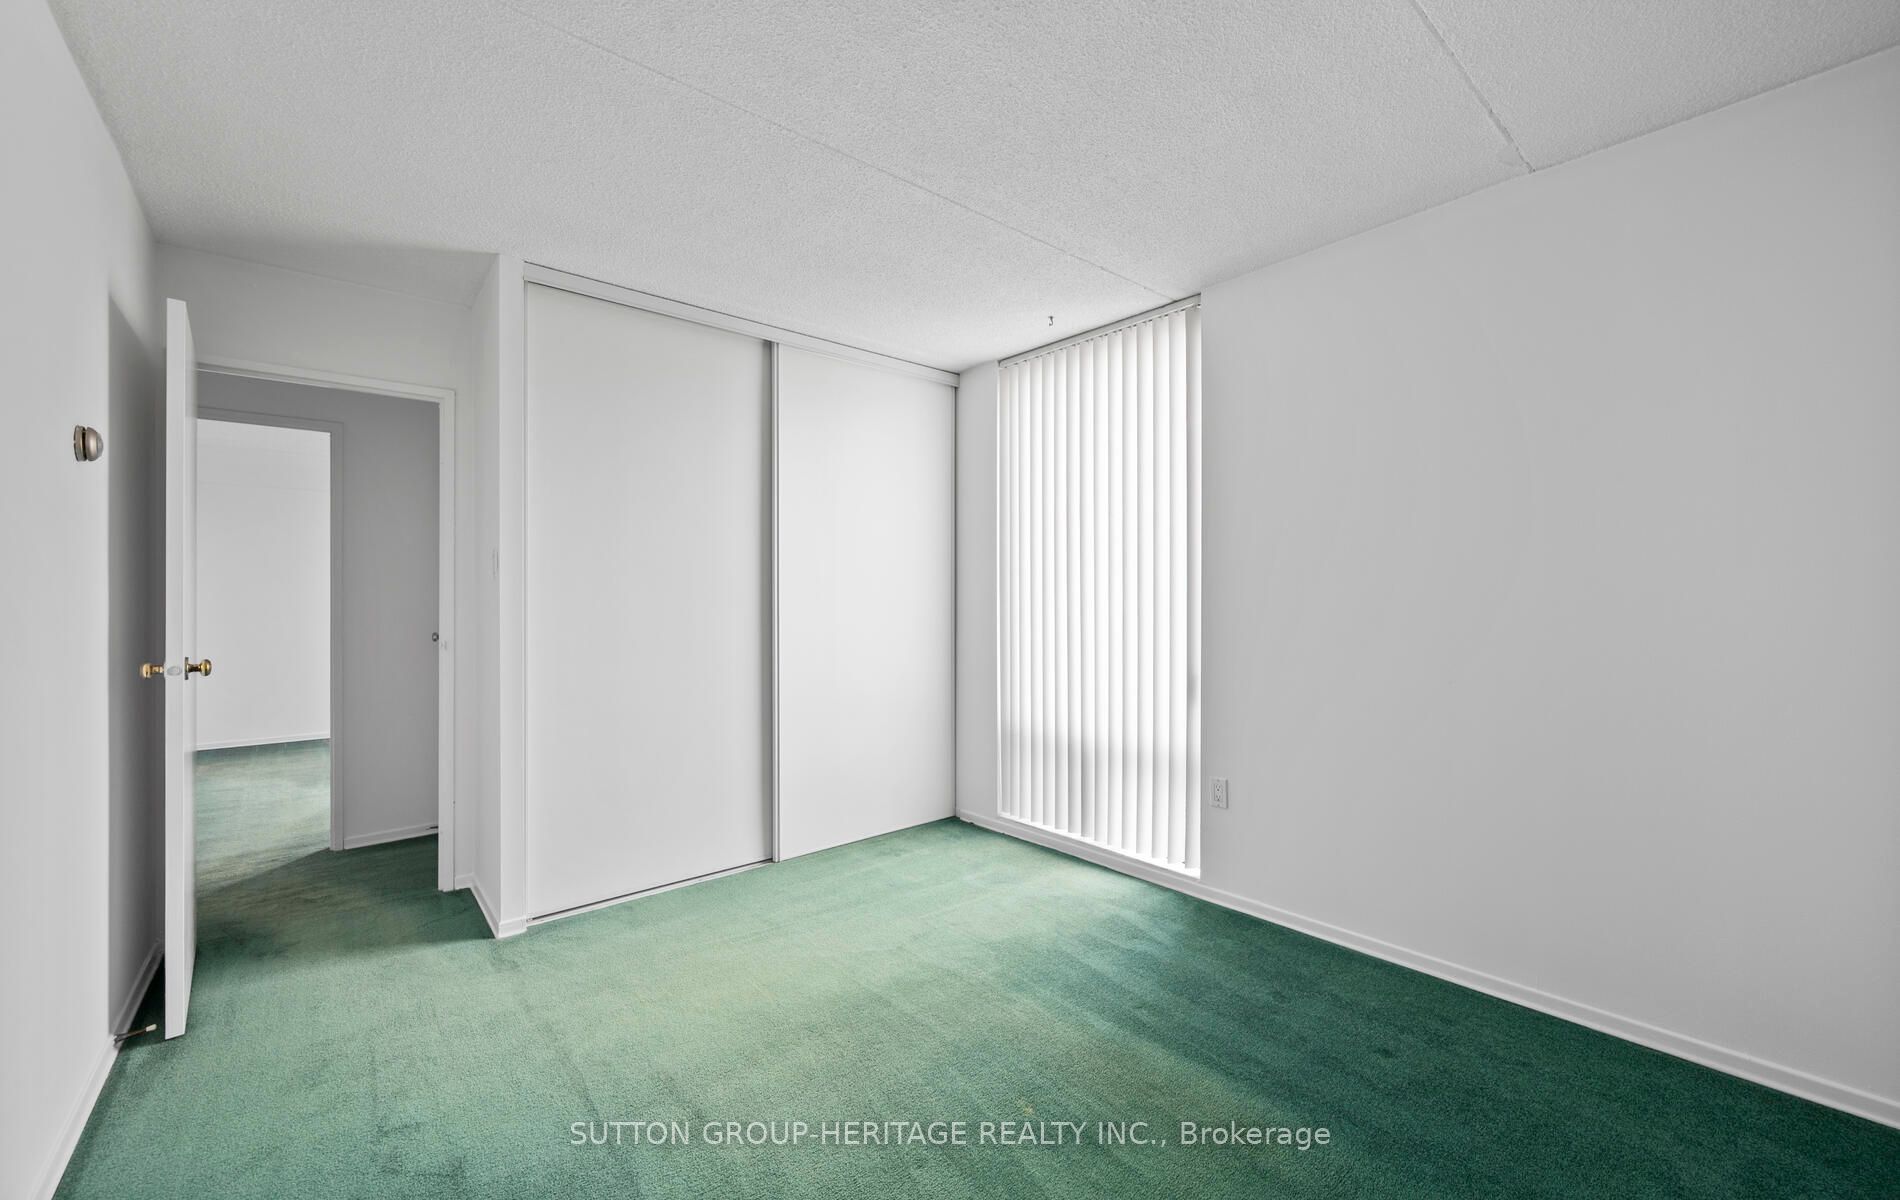
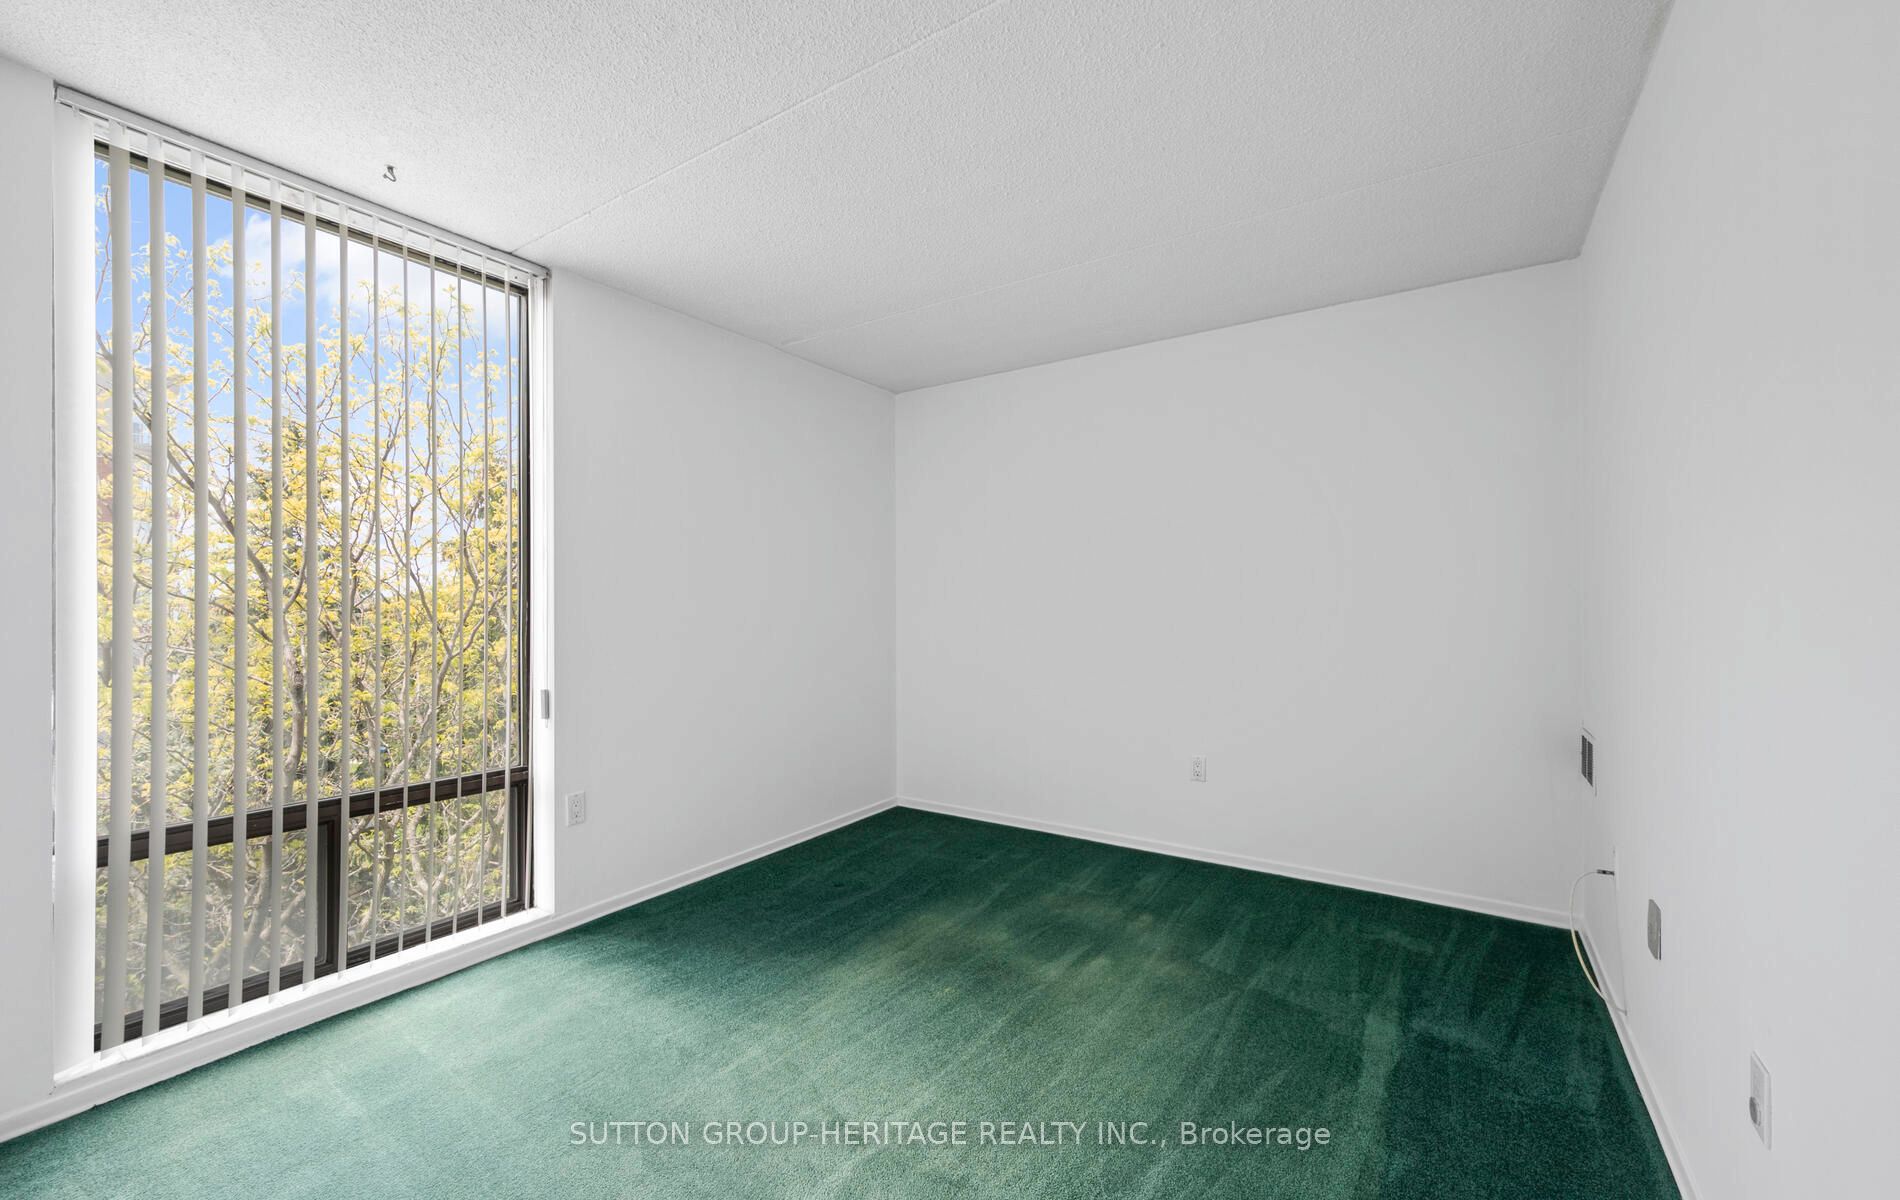
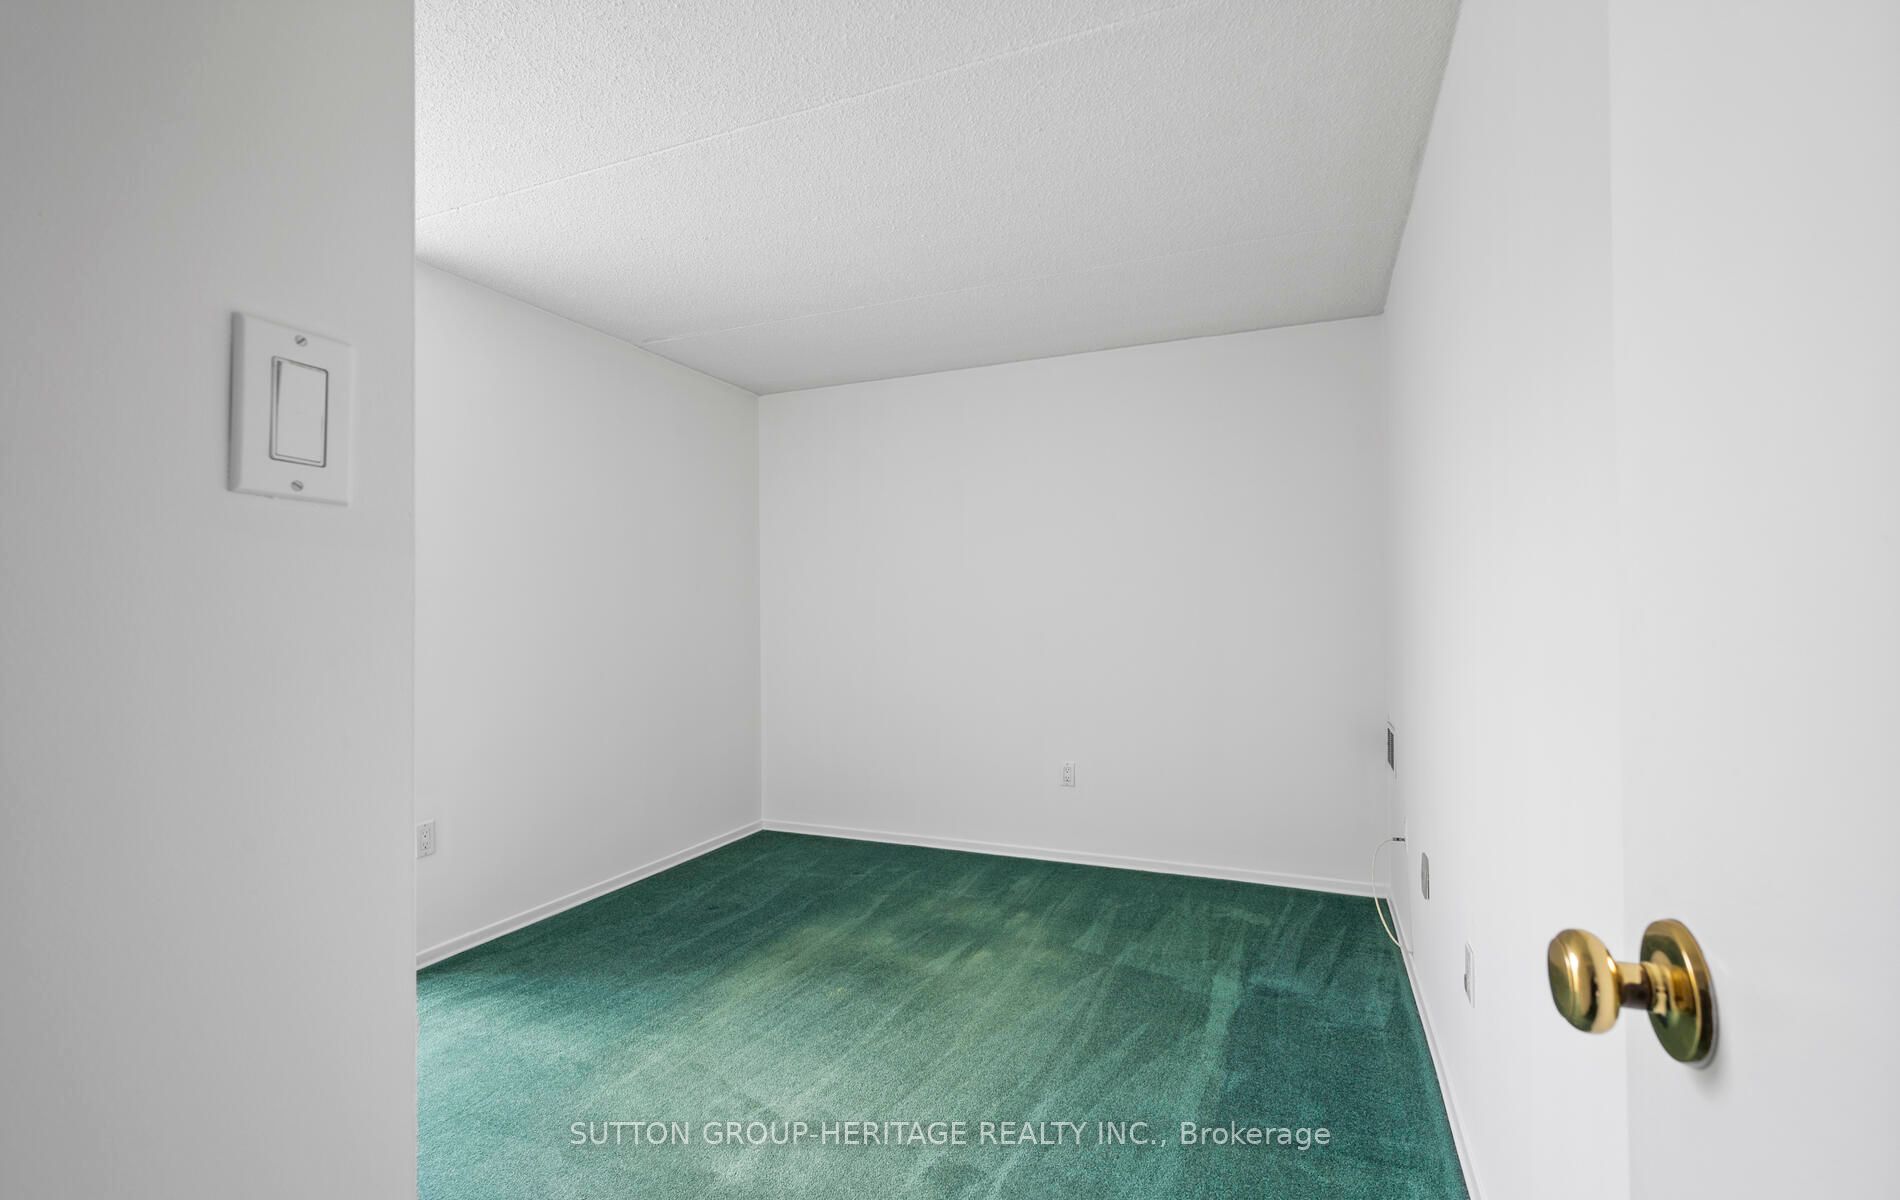
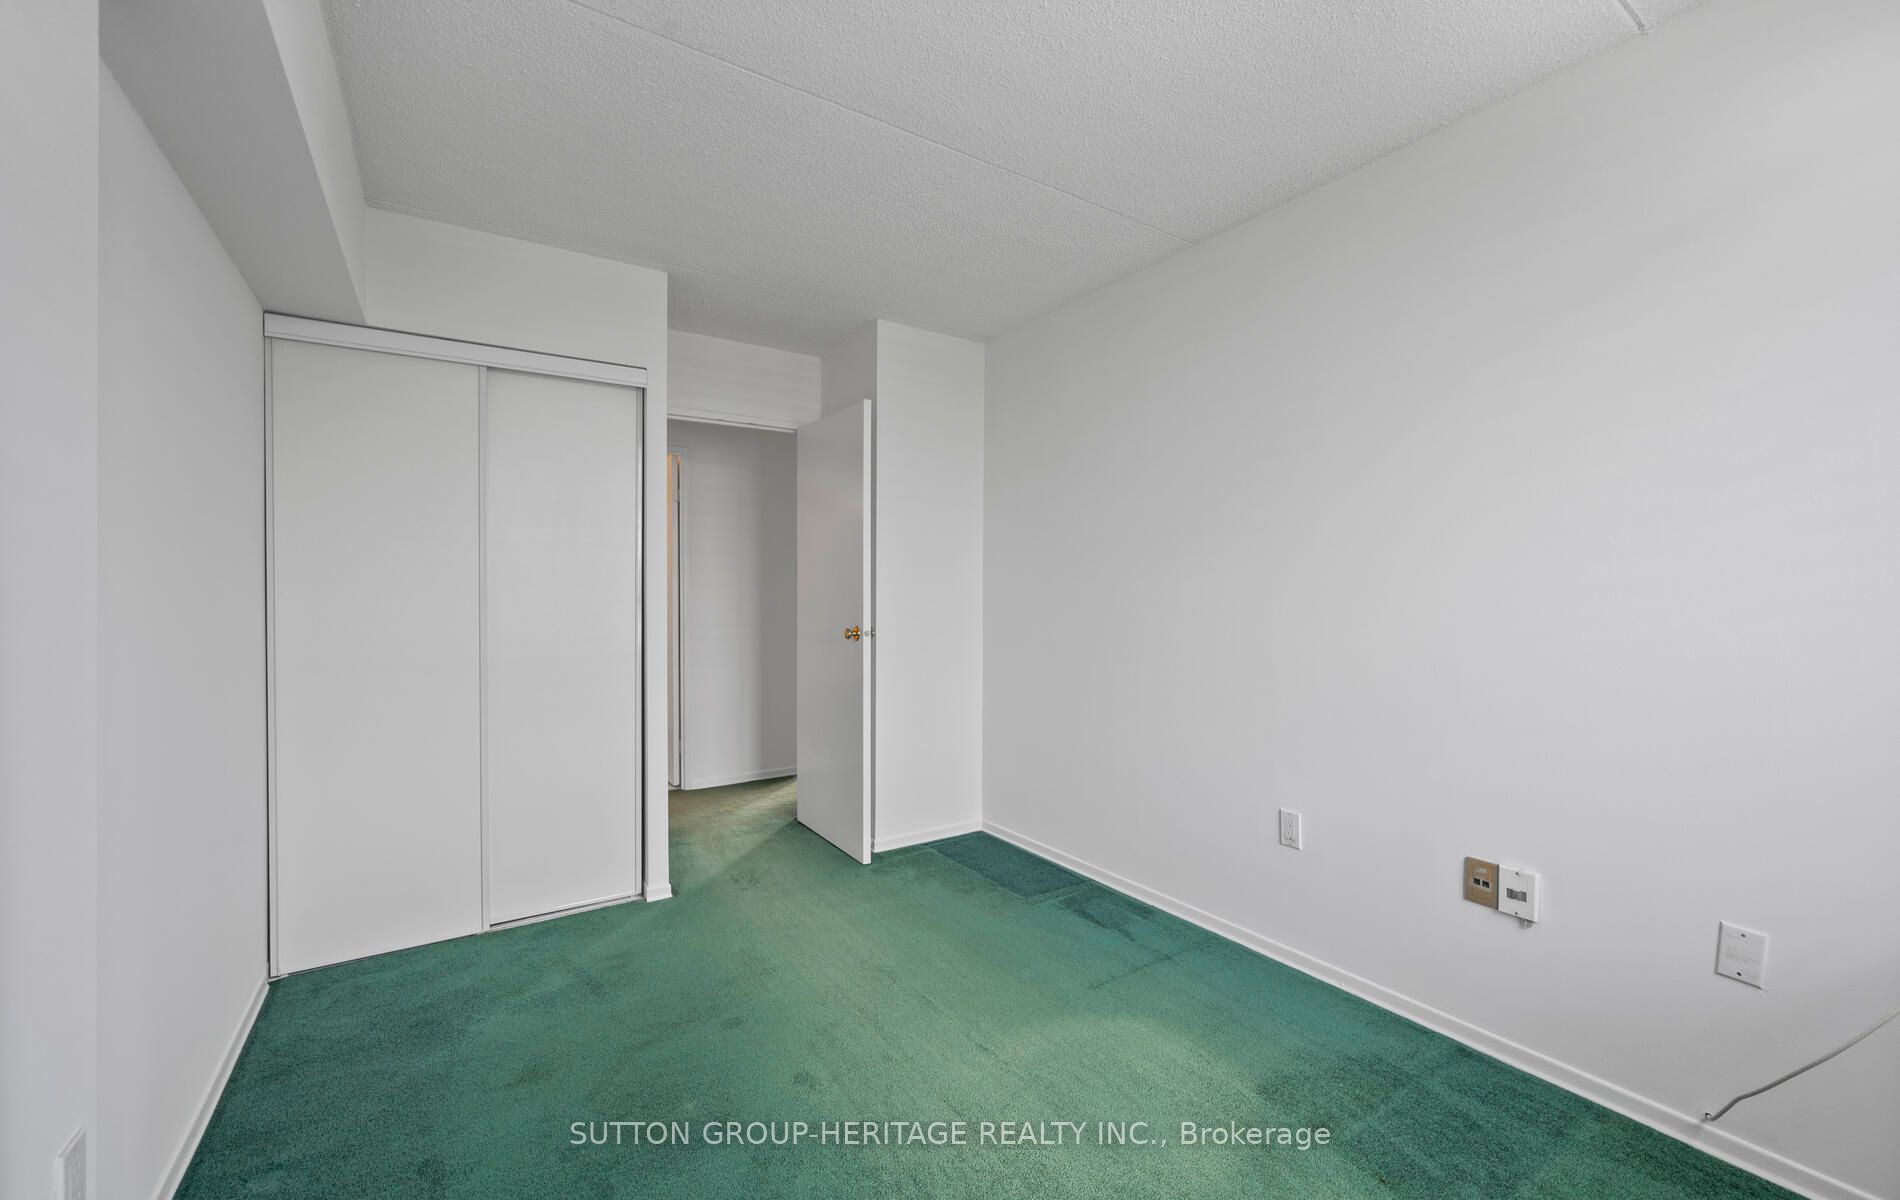
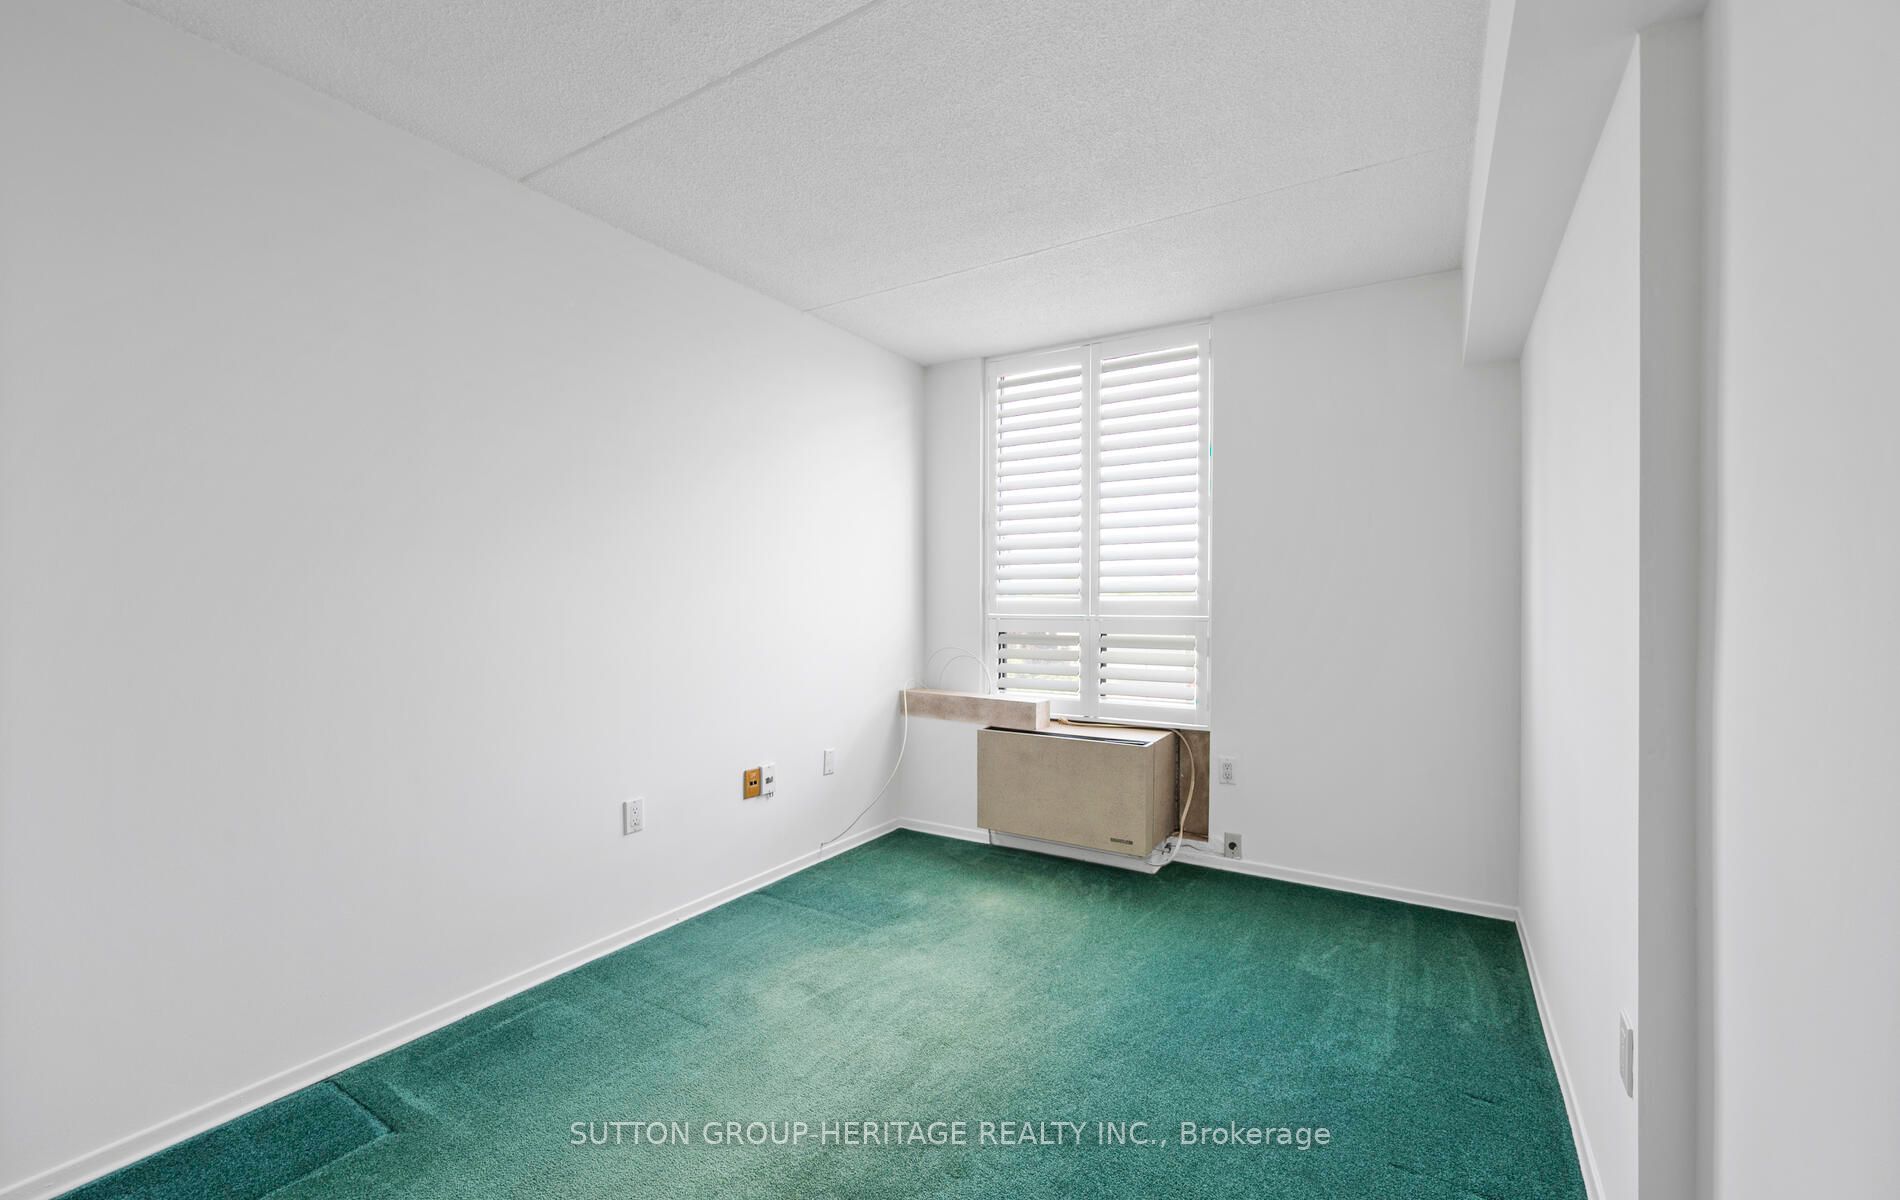
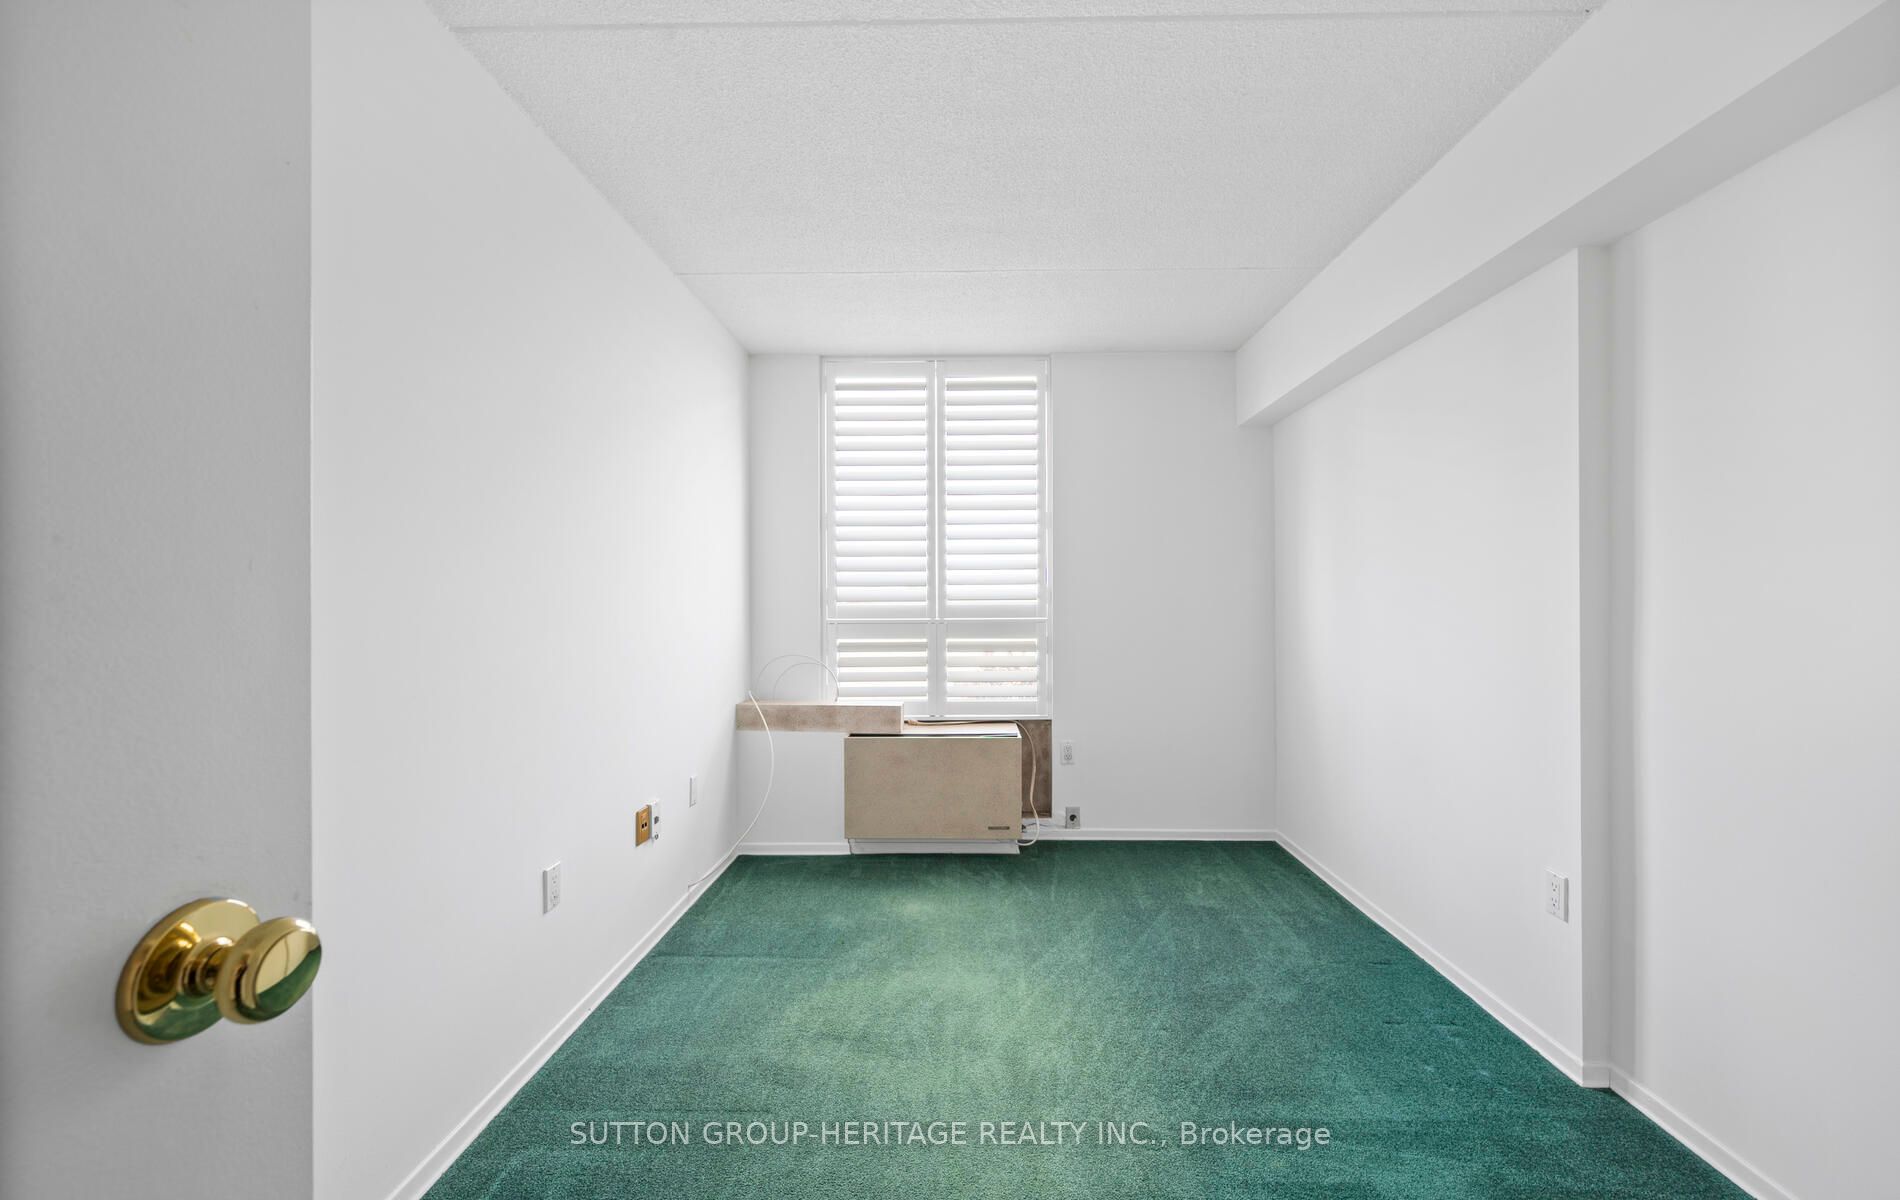
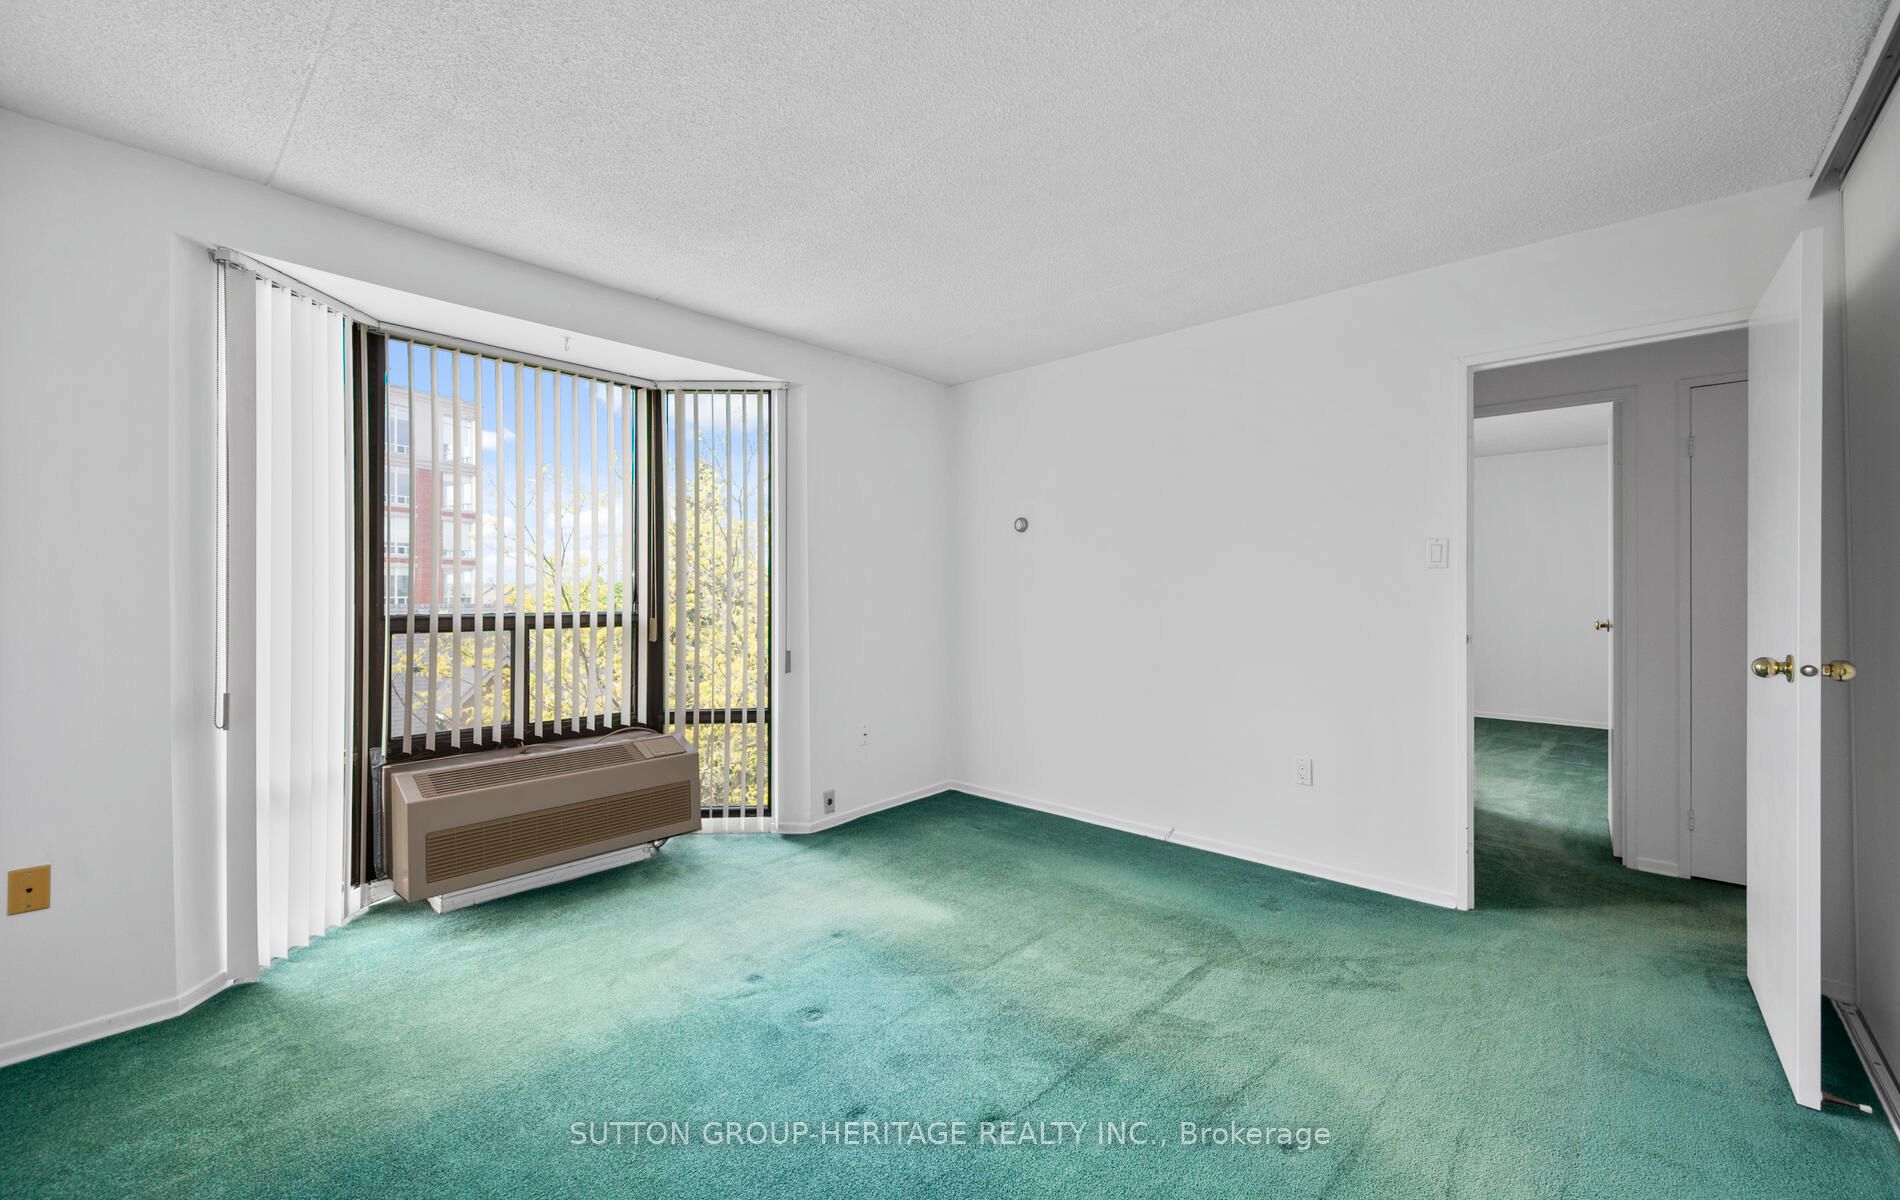
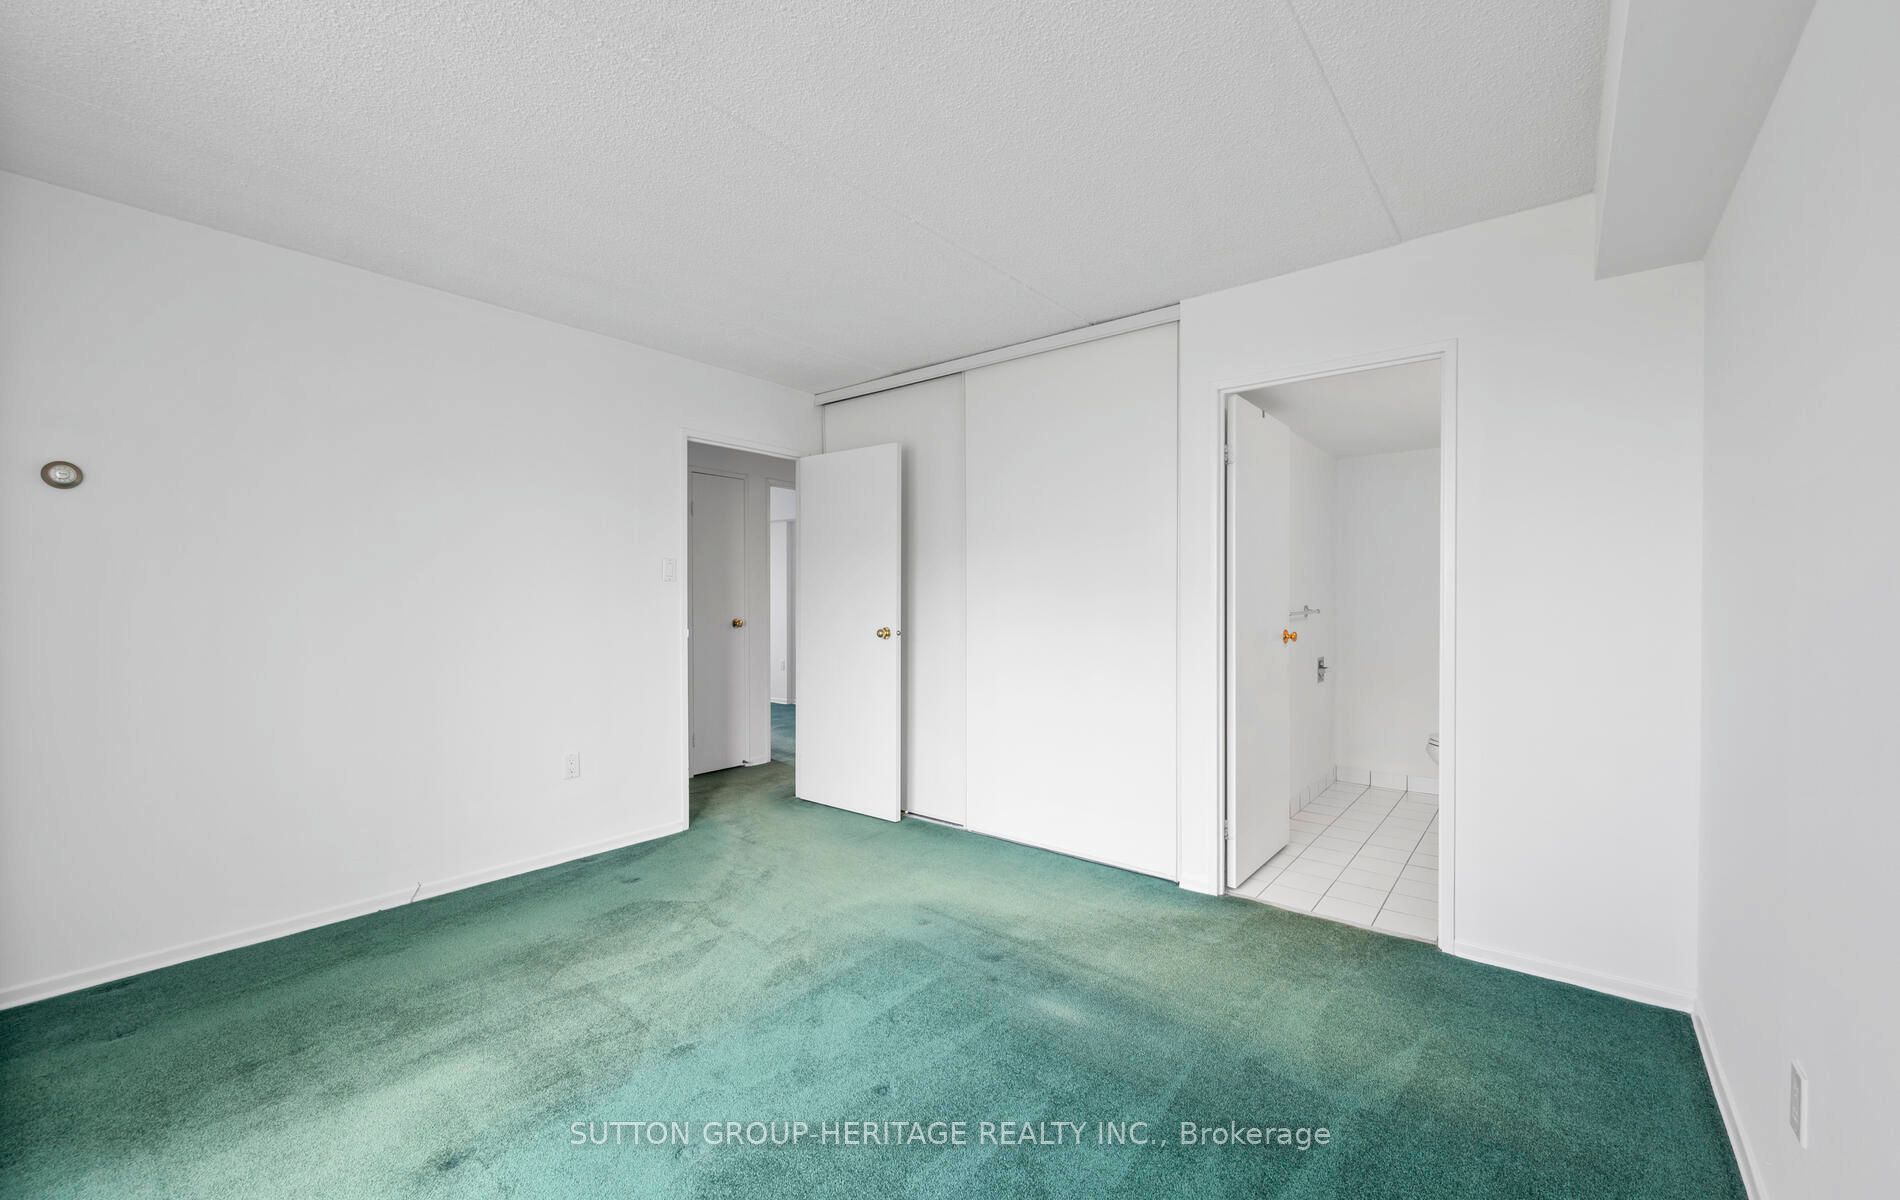
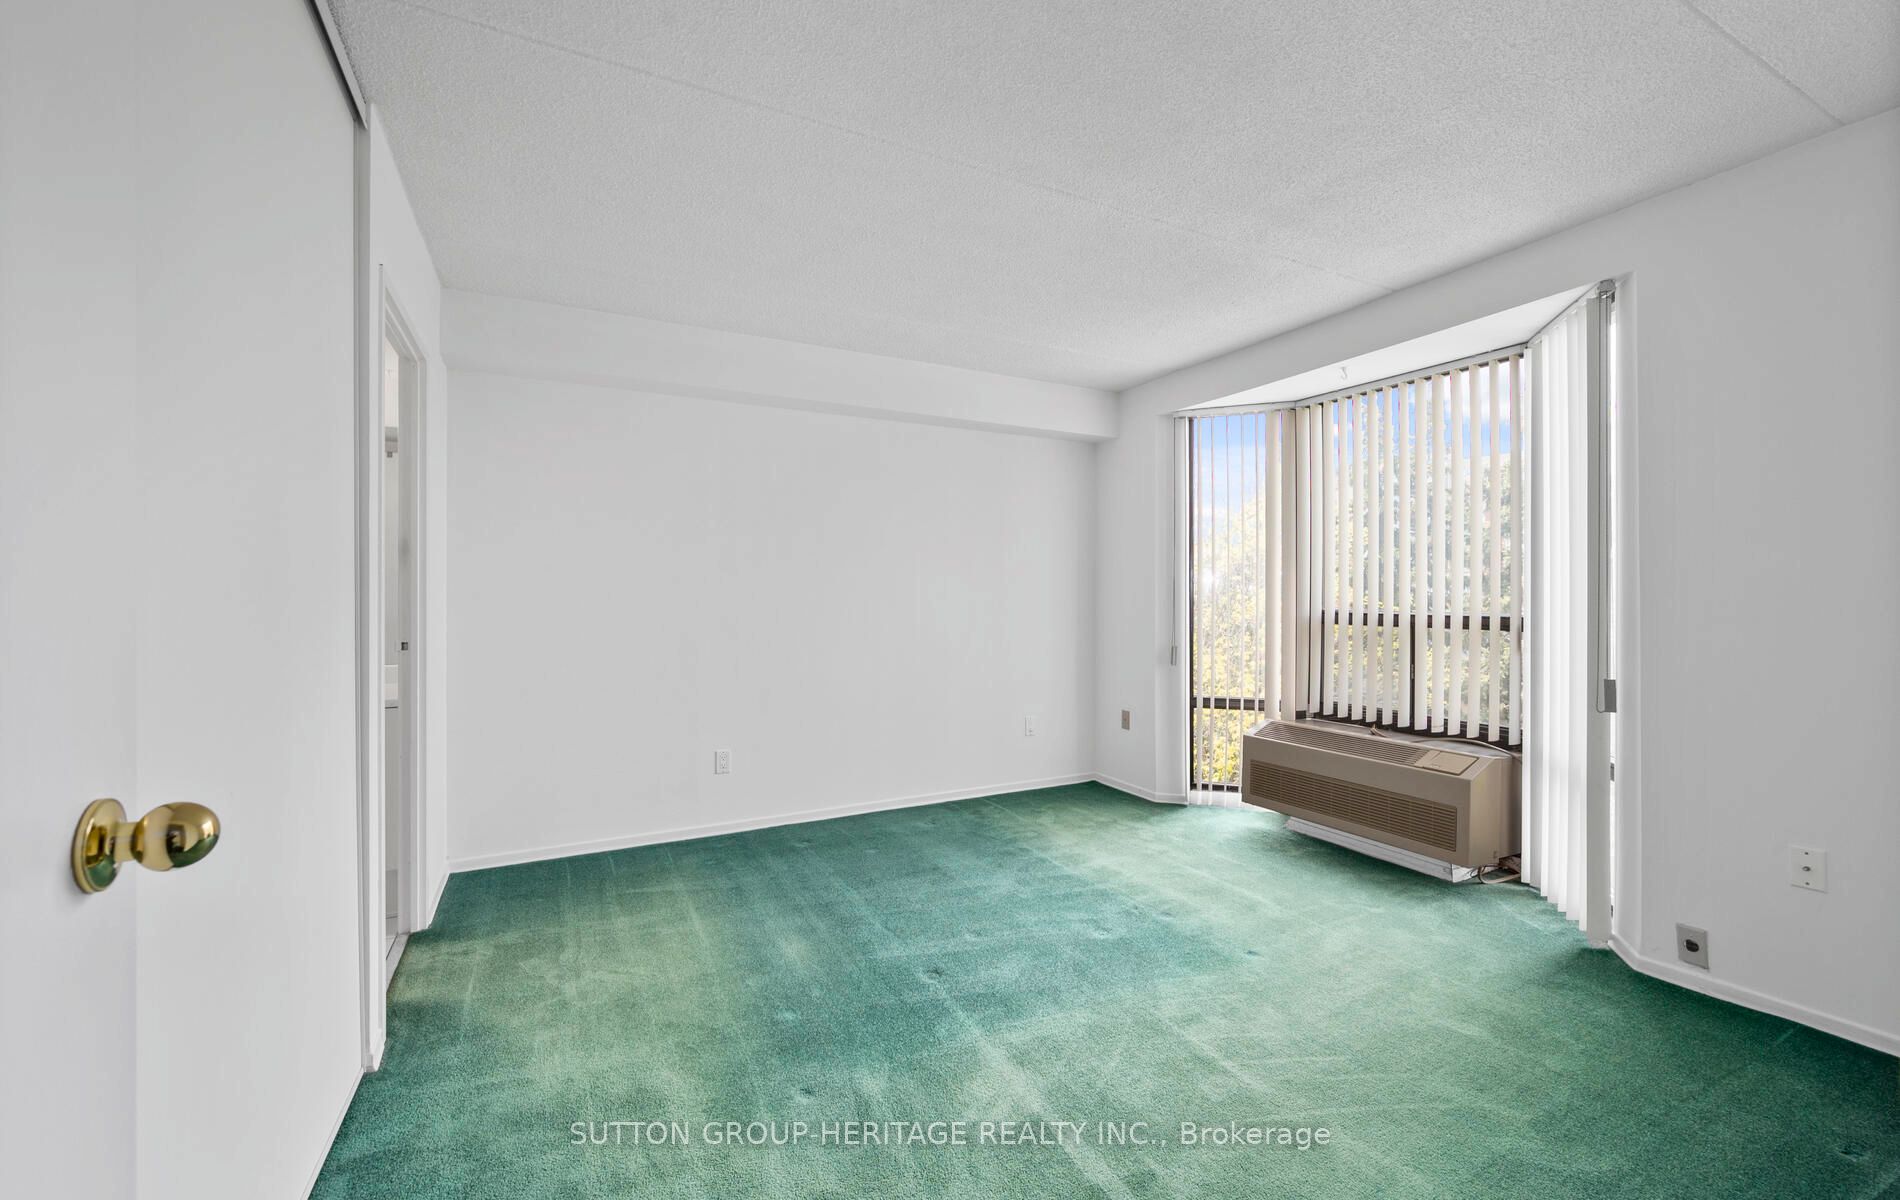
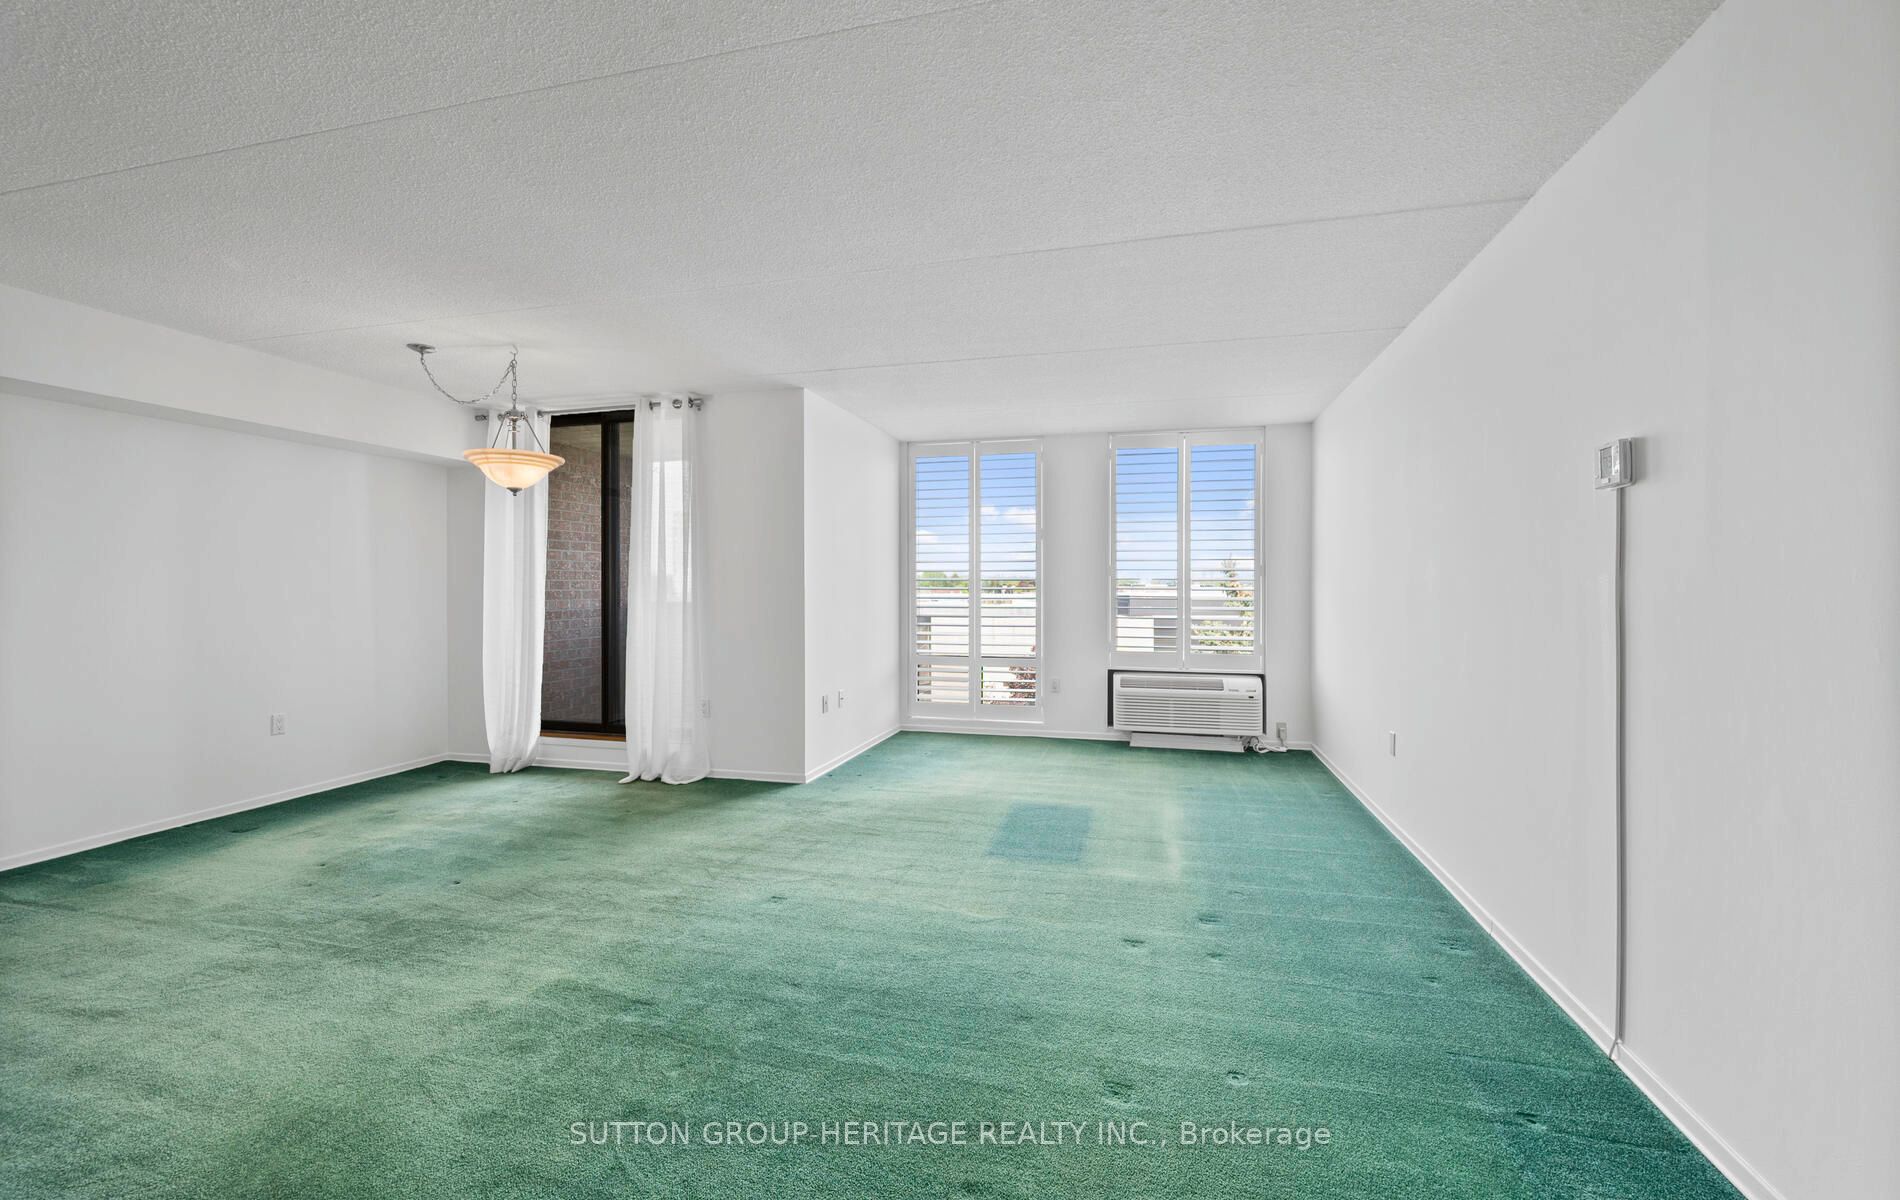
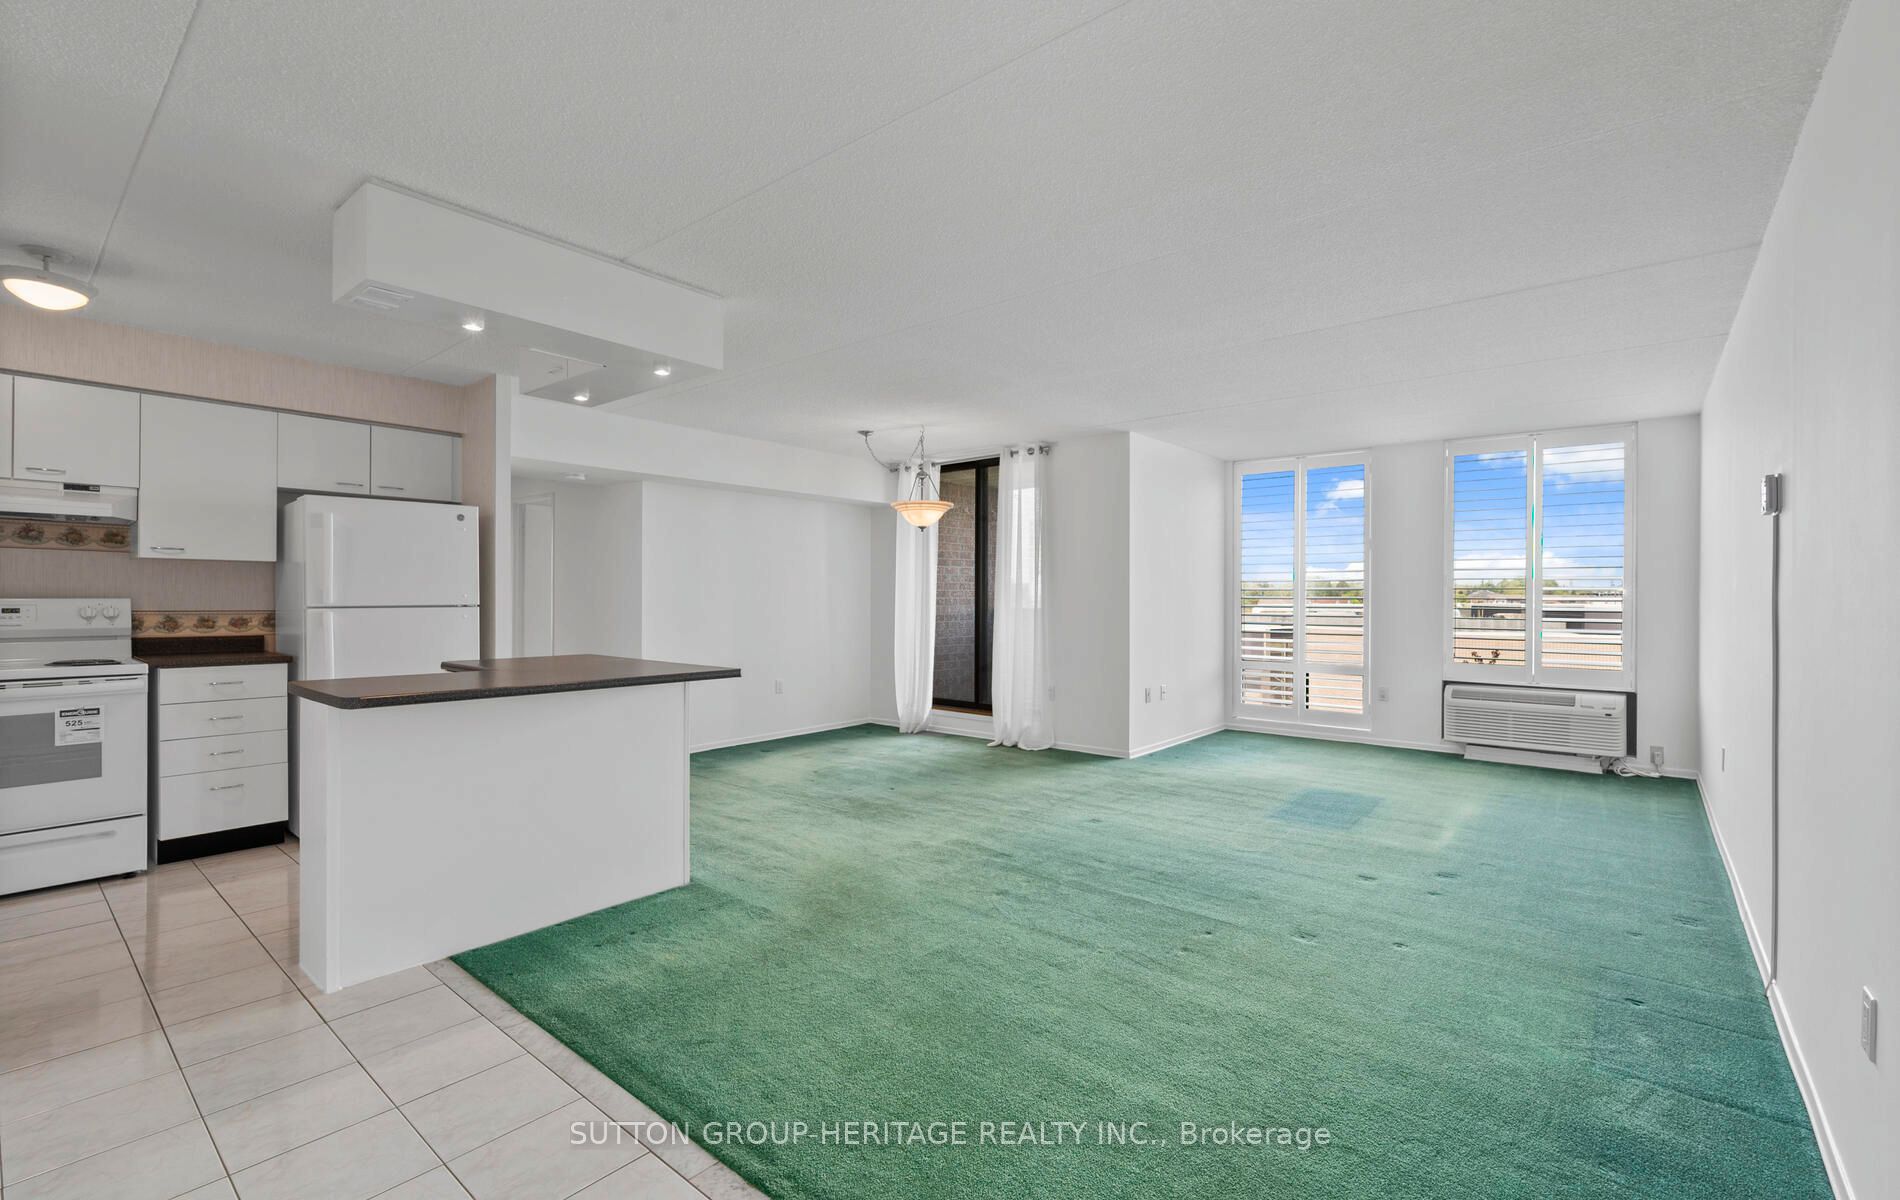
Welcome To The Village at the Pines. This top floor over 1200 sqft three bedroom unit is ready for your personal touch. Open concept living dining and kitchen is spacious and welcoming. Primary bedroom has large windows Located right in the heart of it all you are accessible to Chestnut Hill Rec Ctr, Pickering town Ctr, Town hall major Transit Hubs and more. Two parking spots are included with this unit
Welcome To The Village at the Pines. This top floor over 1200 sqft three bedroom unit is ready for your personal touch. Open concept living dining and kitchen is spacious and welcoming. Primary bedroom has large windows Located right in the heart of it all you are accessible to Chestnut Hill Rec Ctr, Pickering town Ctr, Town hall major Transit Hubs and more. Two parking spots are included with this unit
See MoreKey Info
- Apartment Condo
- 2 Parking
- No Garage
- Kingston Rd. / Valley Farm
- 1200-1399 Approximate Sq Feet
- 31-50 Years Approximate Age
- North Exposure
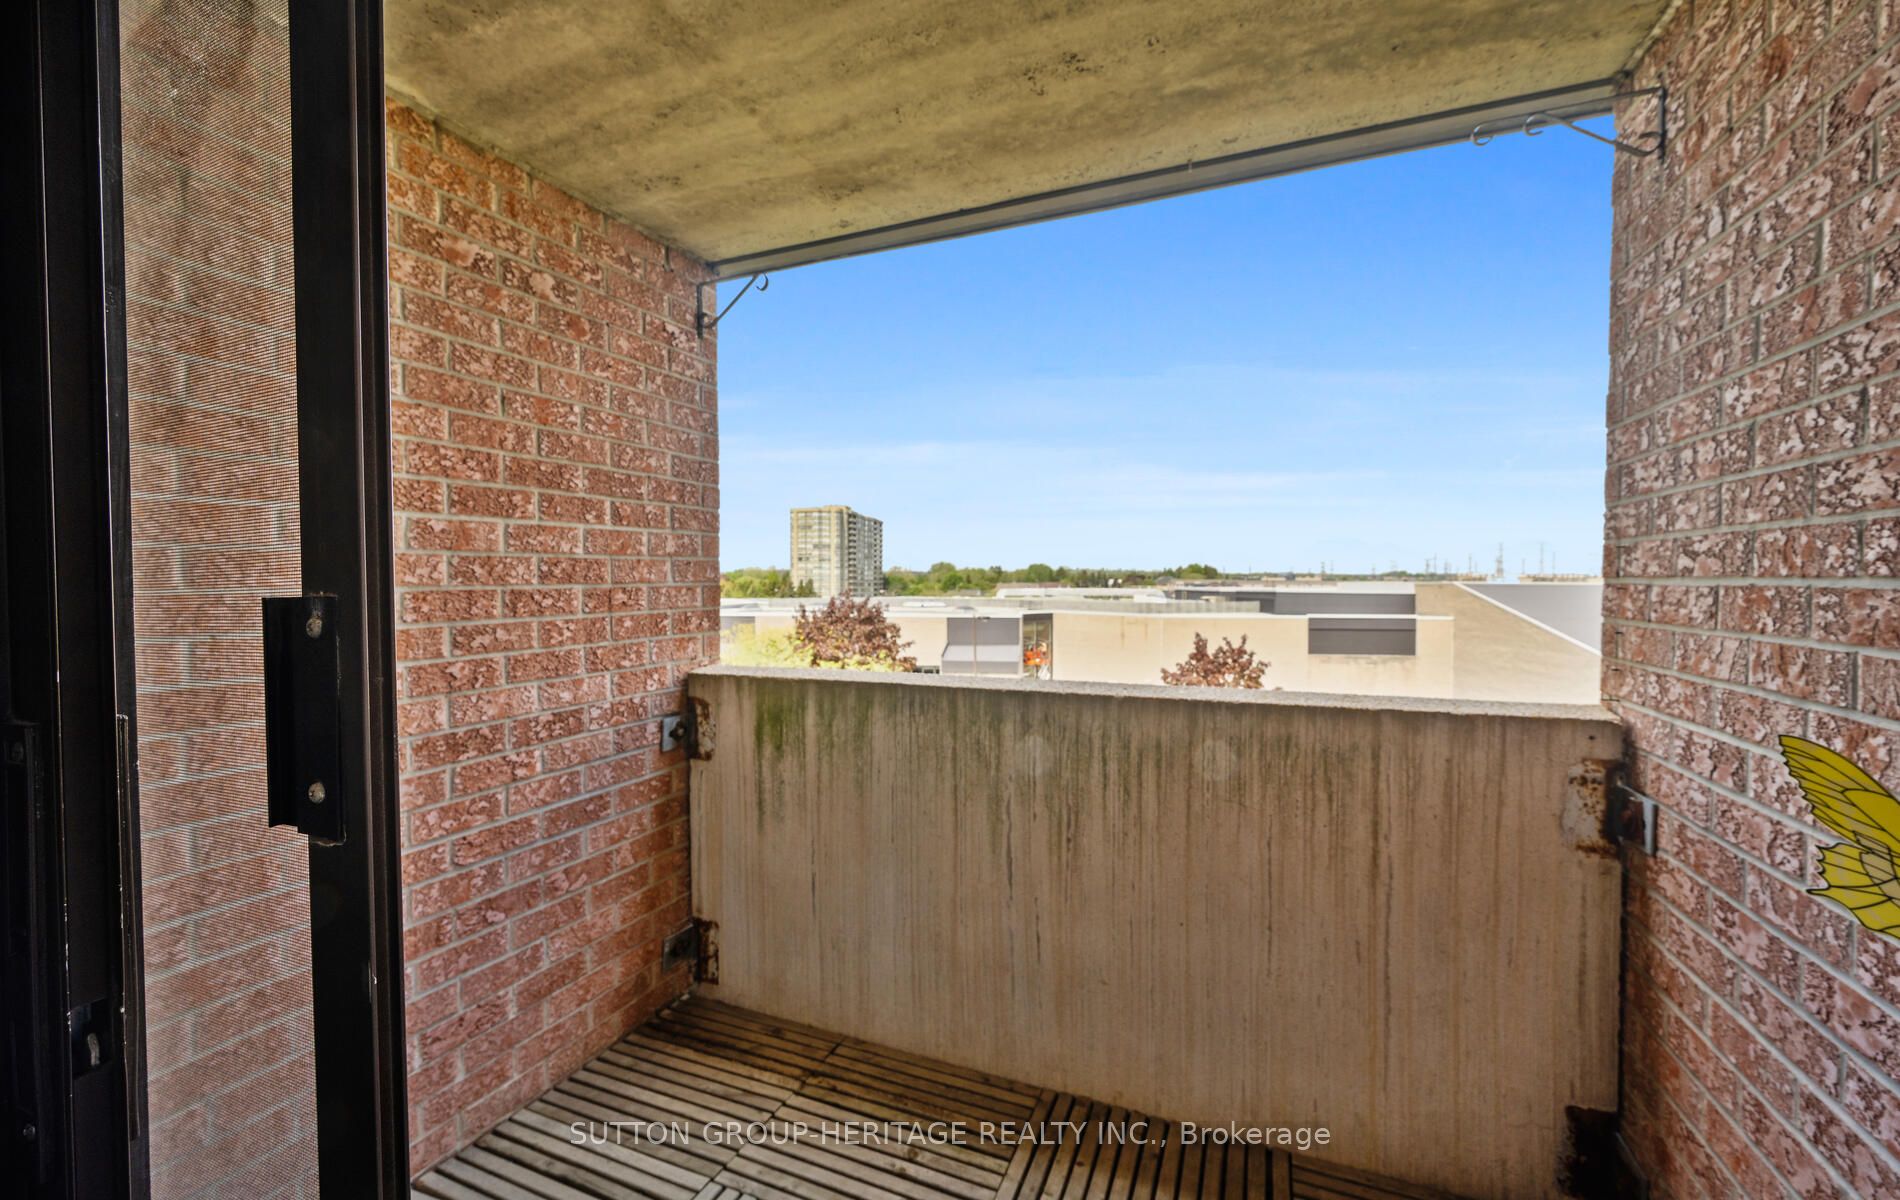
- Open Balcony
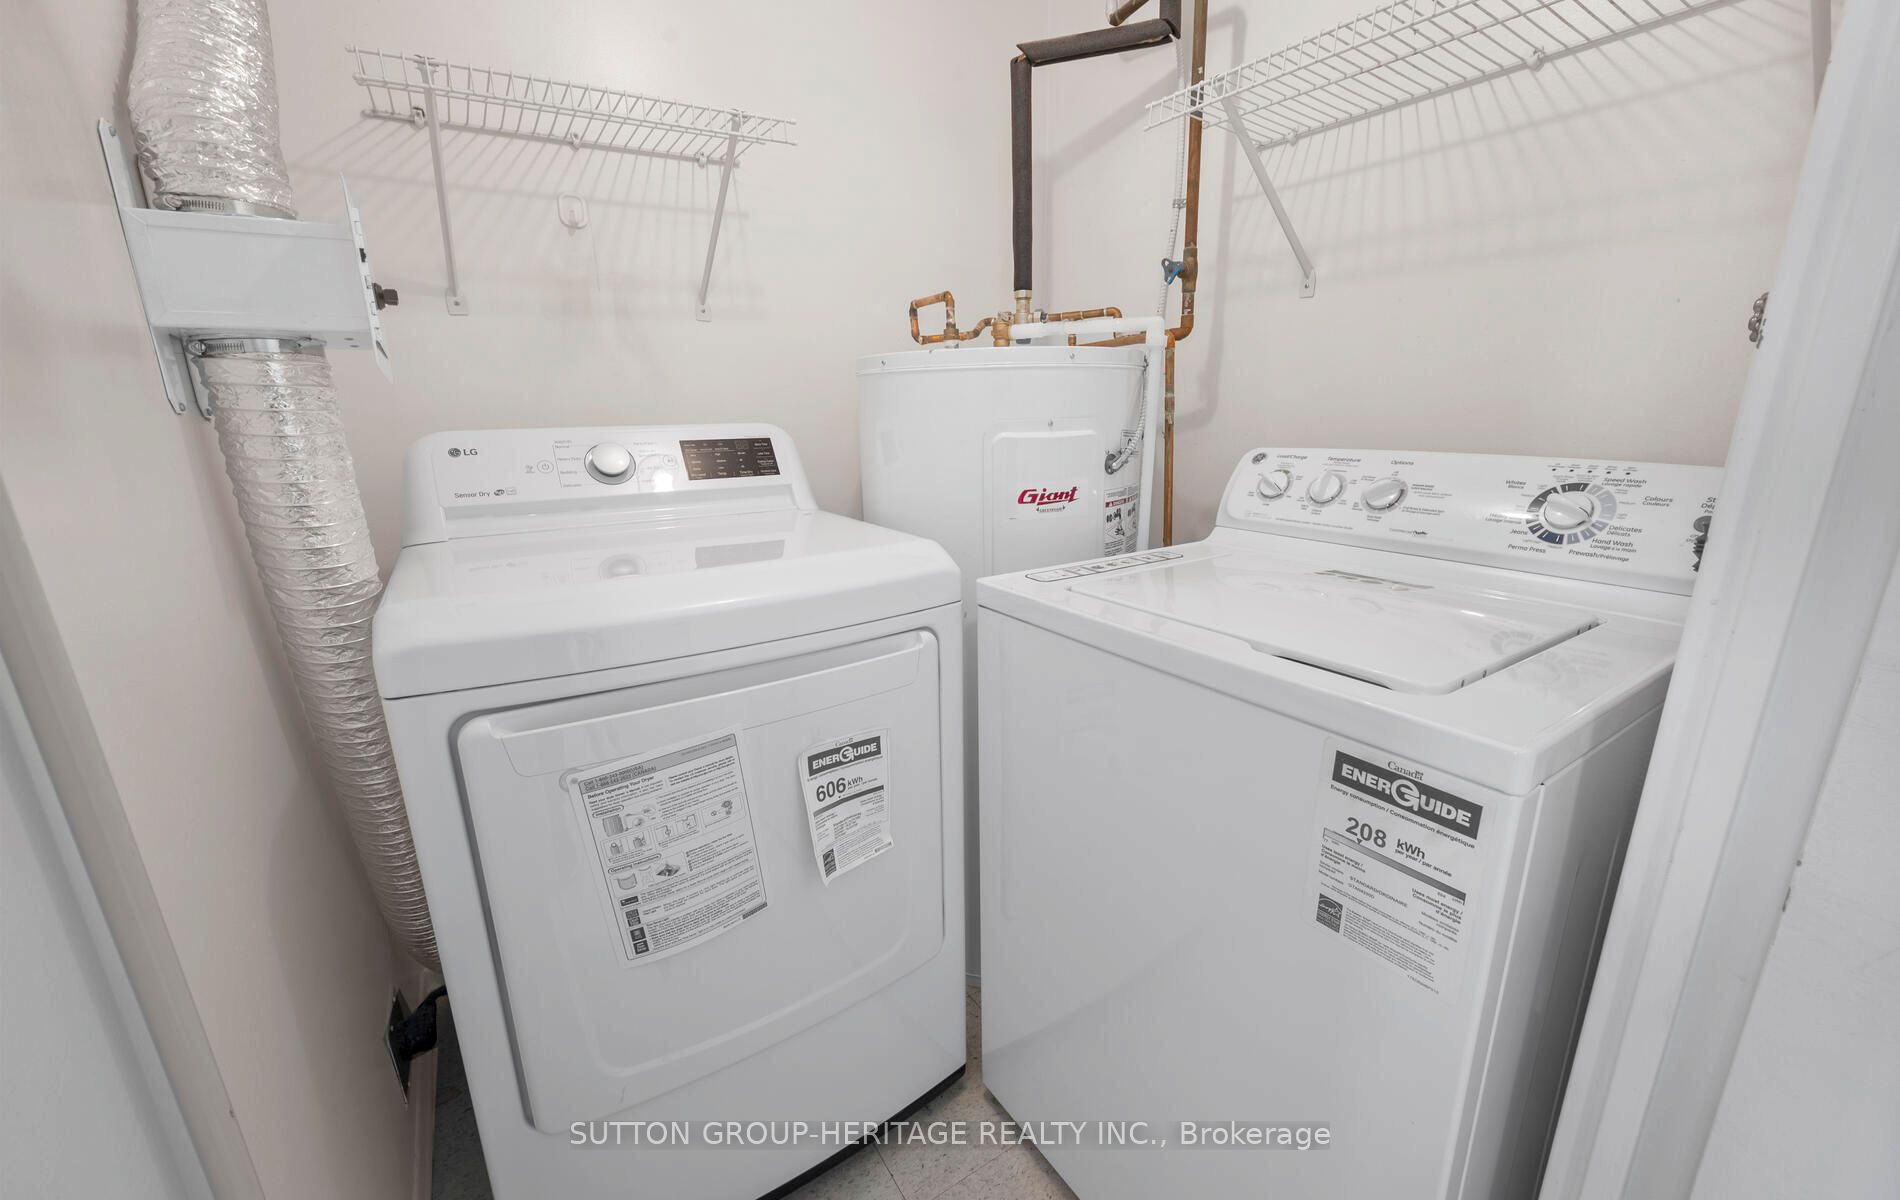
- No Ensuite Laundry
- Ensuite Locker
- HeatPump
Property
- $597 Monthly Condo Fees
- Includes: Water, Cable TV, Common Elements, Parking.
- Excludes: Heat, Hydro, Central A/C, Building Insurance
- Taxes were $3,465 in 2025
- Possession: 30/45/60
Details
- Brick Exterior
- No Fireplace
- 1 Kitchen
- Condo Corporation #136
- Condo Registry Office: DCC
- MLS #E12178693
- SUTTON GROUP-HERITAGE REALTY INC.
Extras
Rooms
| Room | Floor | Dimensions | Details | |
|---|---|---|---|---|
| 1 | Foyer | Flat | 8.63' x 4.17' | Ceramic Floor, Double Closet |
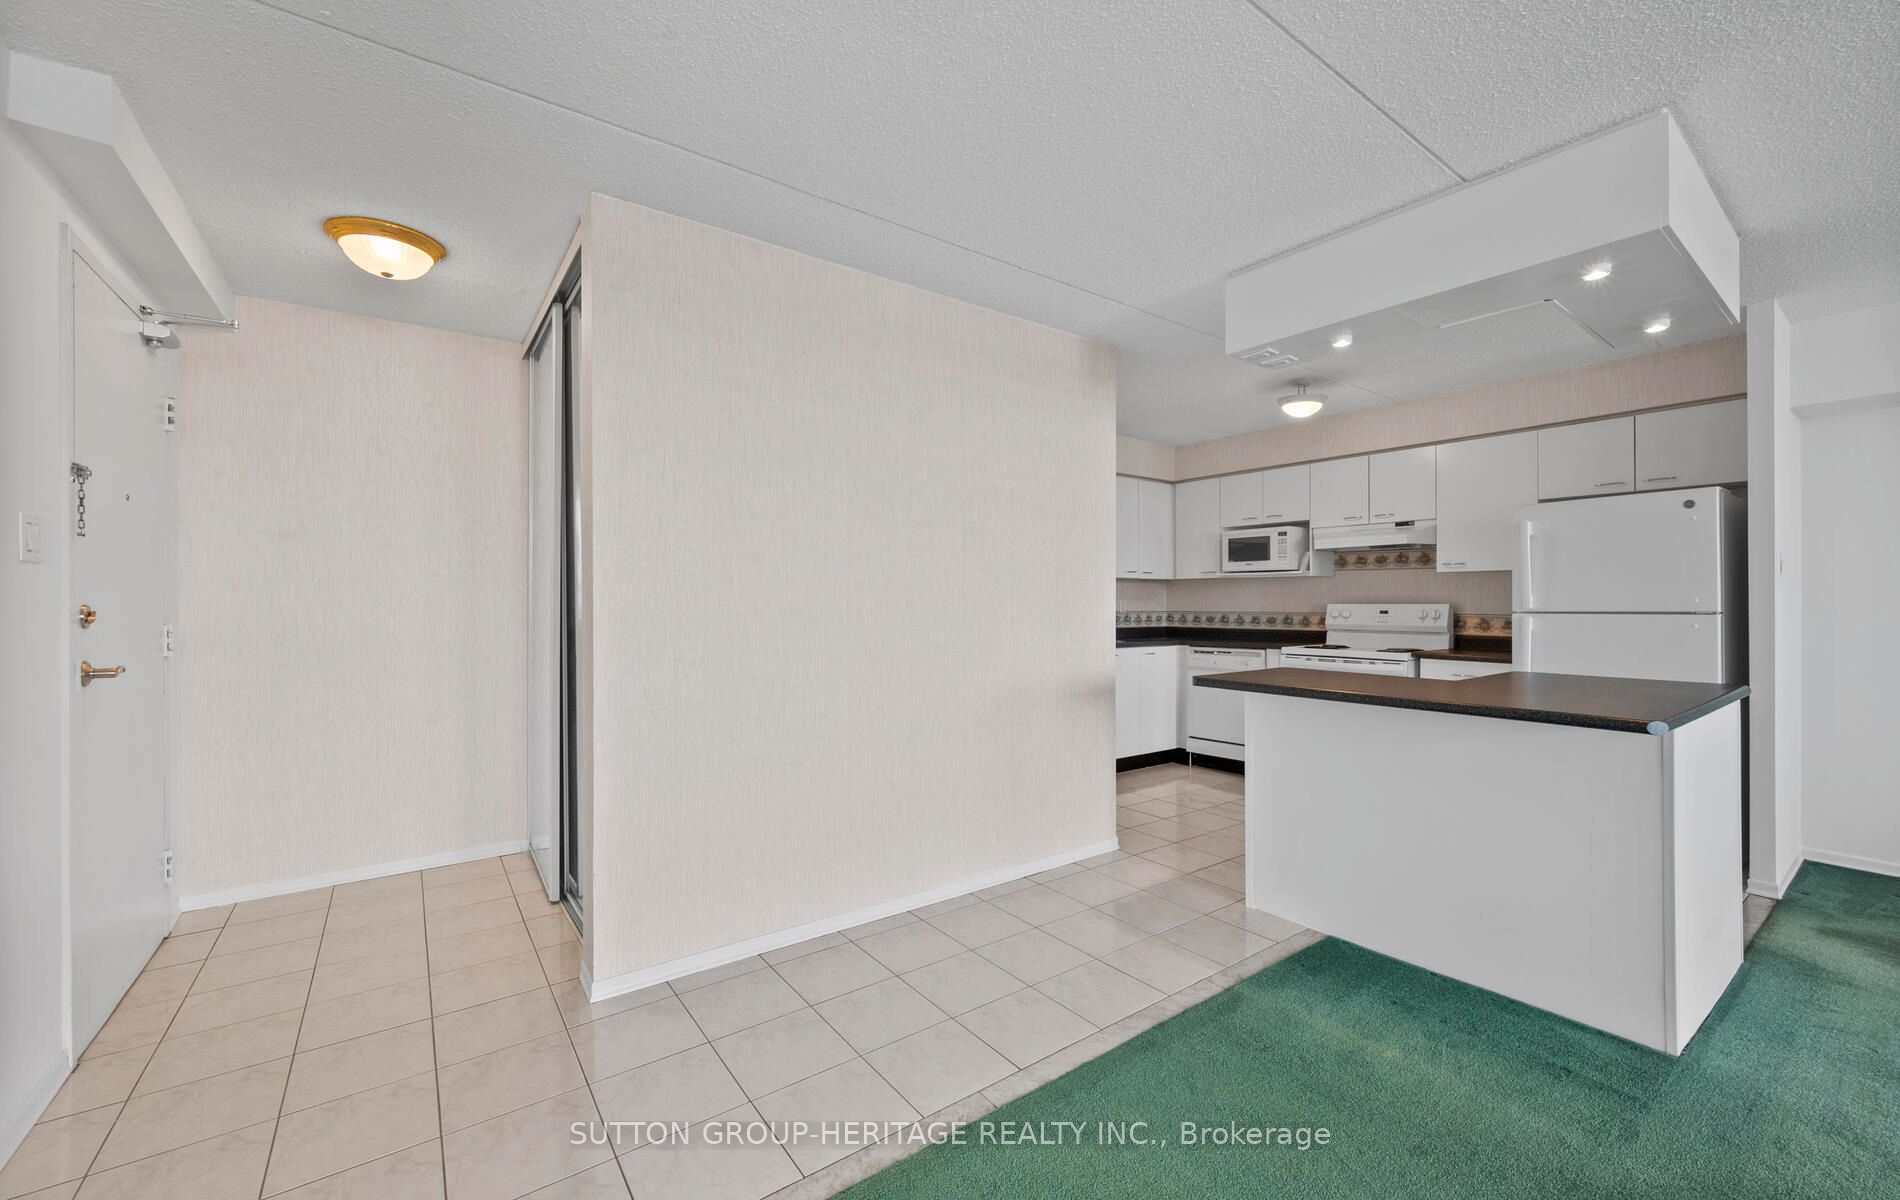
| 2 | Kitchen | Flat | 12.20' x 9.68' | Ceramic Floor, Breakfast Bar, Open Concept |
| 3 | Other | Flat | 6.89' x 6.30' | |
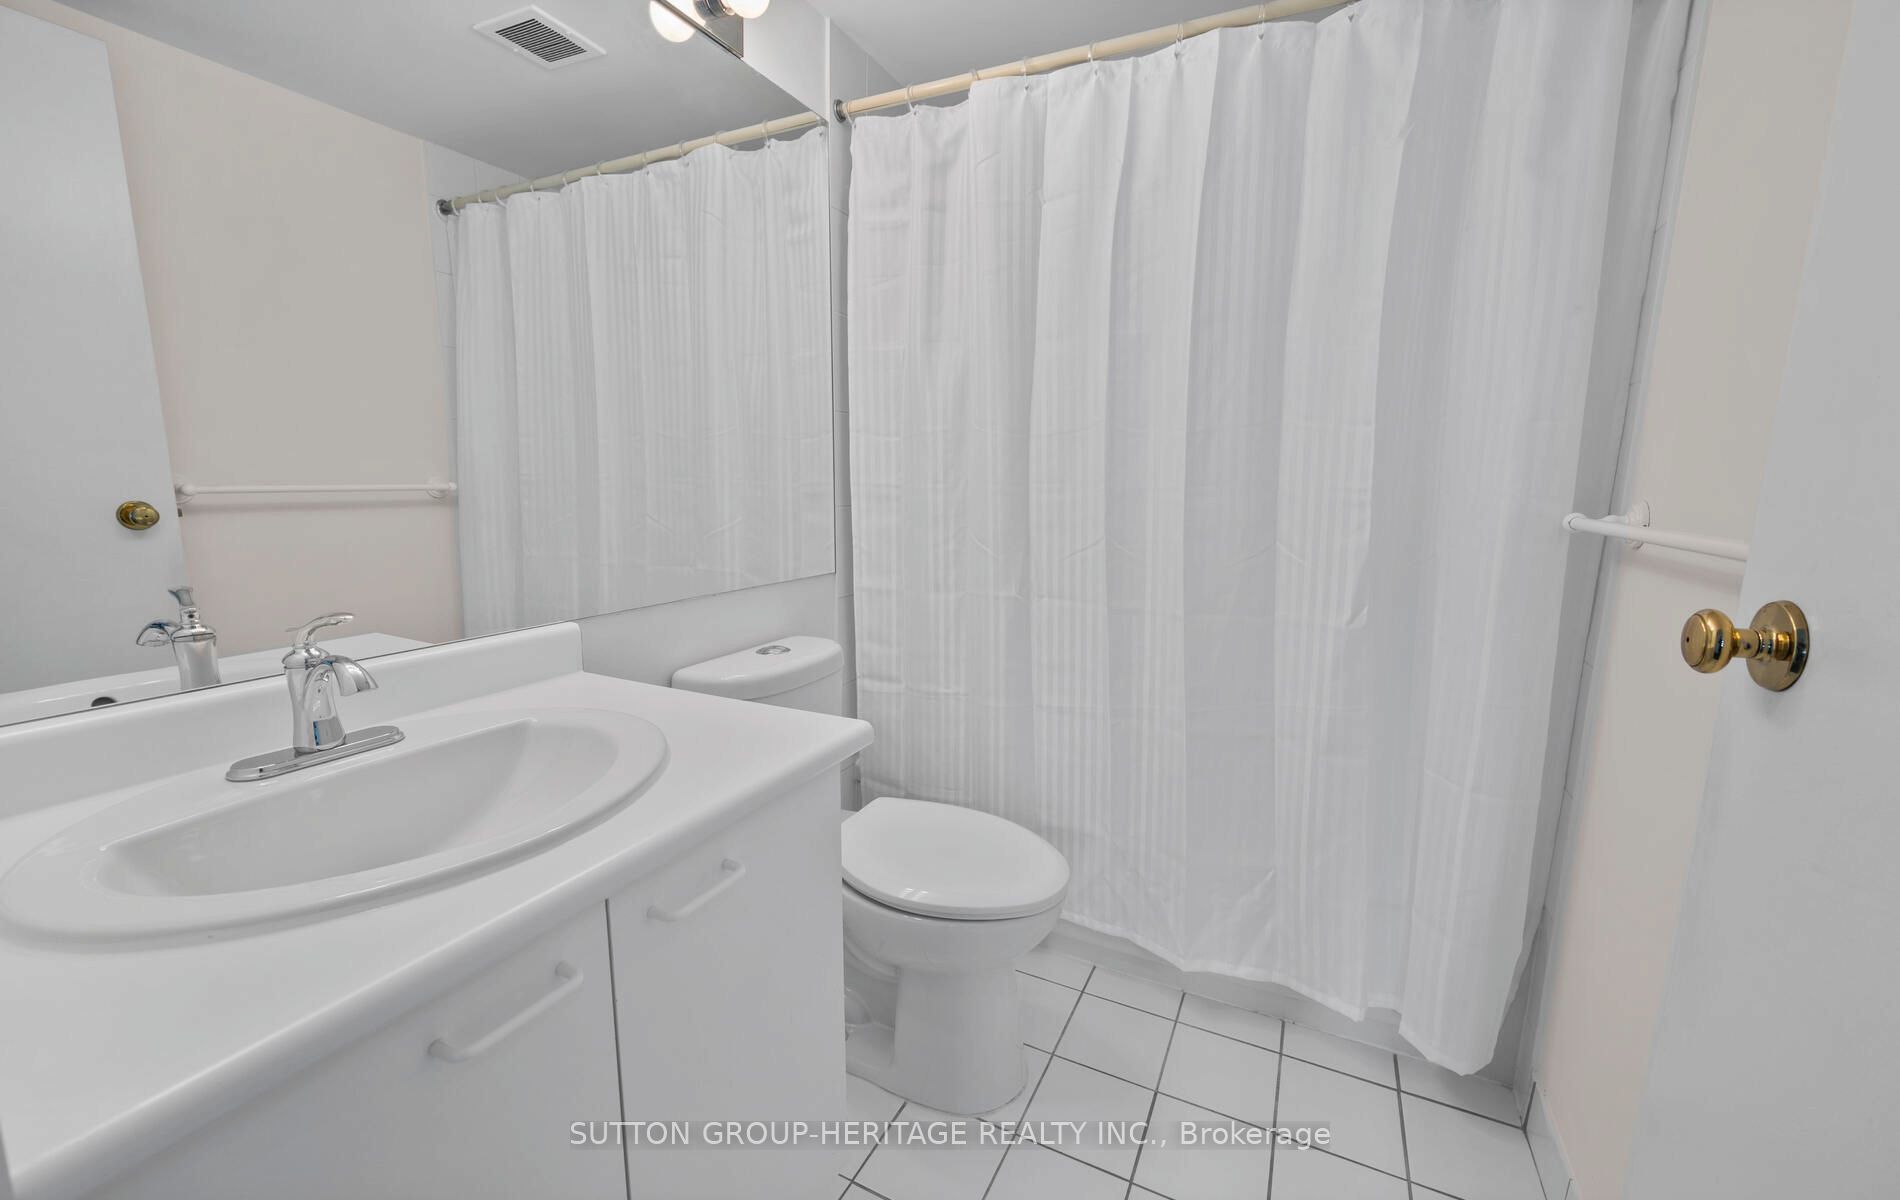
 | 1 2-Piece Bathroom in Flat | |||
| 1 4-Piece Bathroom in Flat | |||
Who lives here?
Town Centre, Pickering is an east GTA neighbourhood notable for its singles and renters. It has a higher than average population of immigrants, particularly those from the UK. Residents tend to be older with a significant number of seniors aged 65 & above.
Families
Kids Per Family
1.0
kids per family
in the neighbourhood.
Gta ({{ '1.29999995231628' | number: 1 }})
Singles
54%
of residents are
single and loving it.
54% singles
Pickering (43%)Gta ({{ '44.8800010681152' | number: 0 }}%)
Renters
30%
of residents
are renters.
30% renters
Pickering (13%)Gta ({{ '33.0200004577637' | number: 0 }}%)
Education
28%
of residents are
university grads.
28% university grads
Pickering (35%)Gta ({{ '43.6699981689453' | number: 0 }}%)
Income
Average Household Income
$85K
is the average household
income in the neighbourhood.
Gta ({{ '135056.828125' | minifiedCurrency }})
Professions
Professions
| Sales | 13% |
| Business | 10% |
| Trades | 7% |
| Government | 7% |
| Management | 4% |
Immigrants
42%
of residents were
born outside of Canada.
42% immigrants
Pickering (36%)Gta ({{ '45.4300003051758' | number: 0 }}%)
Birthplace - All
8.3% from Caribbean
All-time
Birthplace - Recent
0.6% from India
Recent
Foreign Languages
Foreign Languages
| Urdu | 3% |
| Tagalog | 2% |
| Tamil | 2% |
| Spanish | 2% |
| French | 2% |
Religions
Religions
| Christian | 65% |
| Muslim | 8% |
| Hindu | 3% |
| Jewish | 1% |
| Buddhist | 1% |