$445,000 Sold Price
$459,990Asking Price
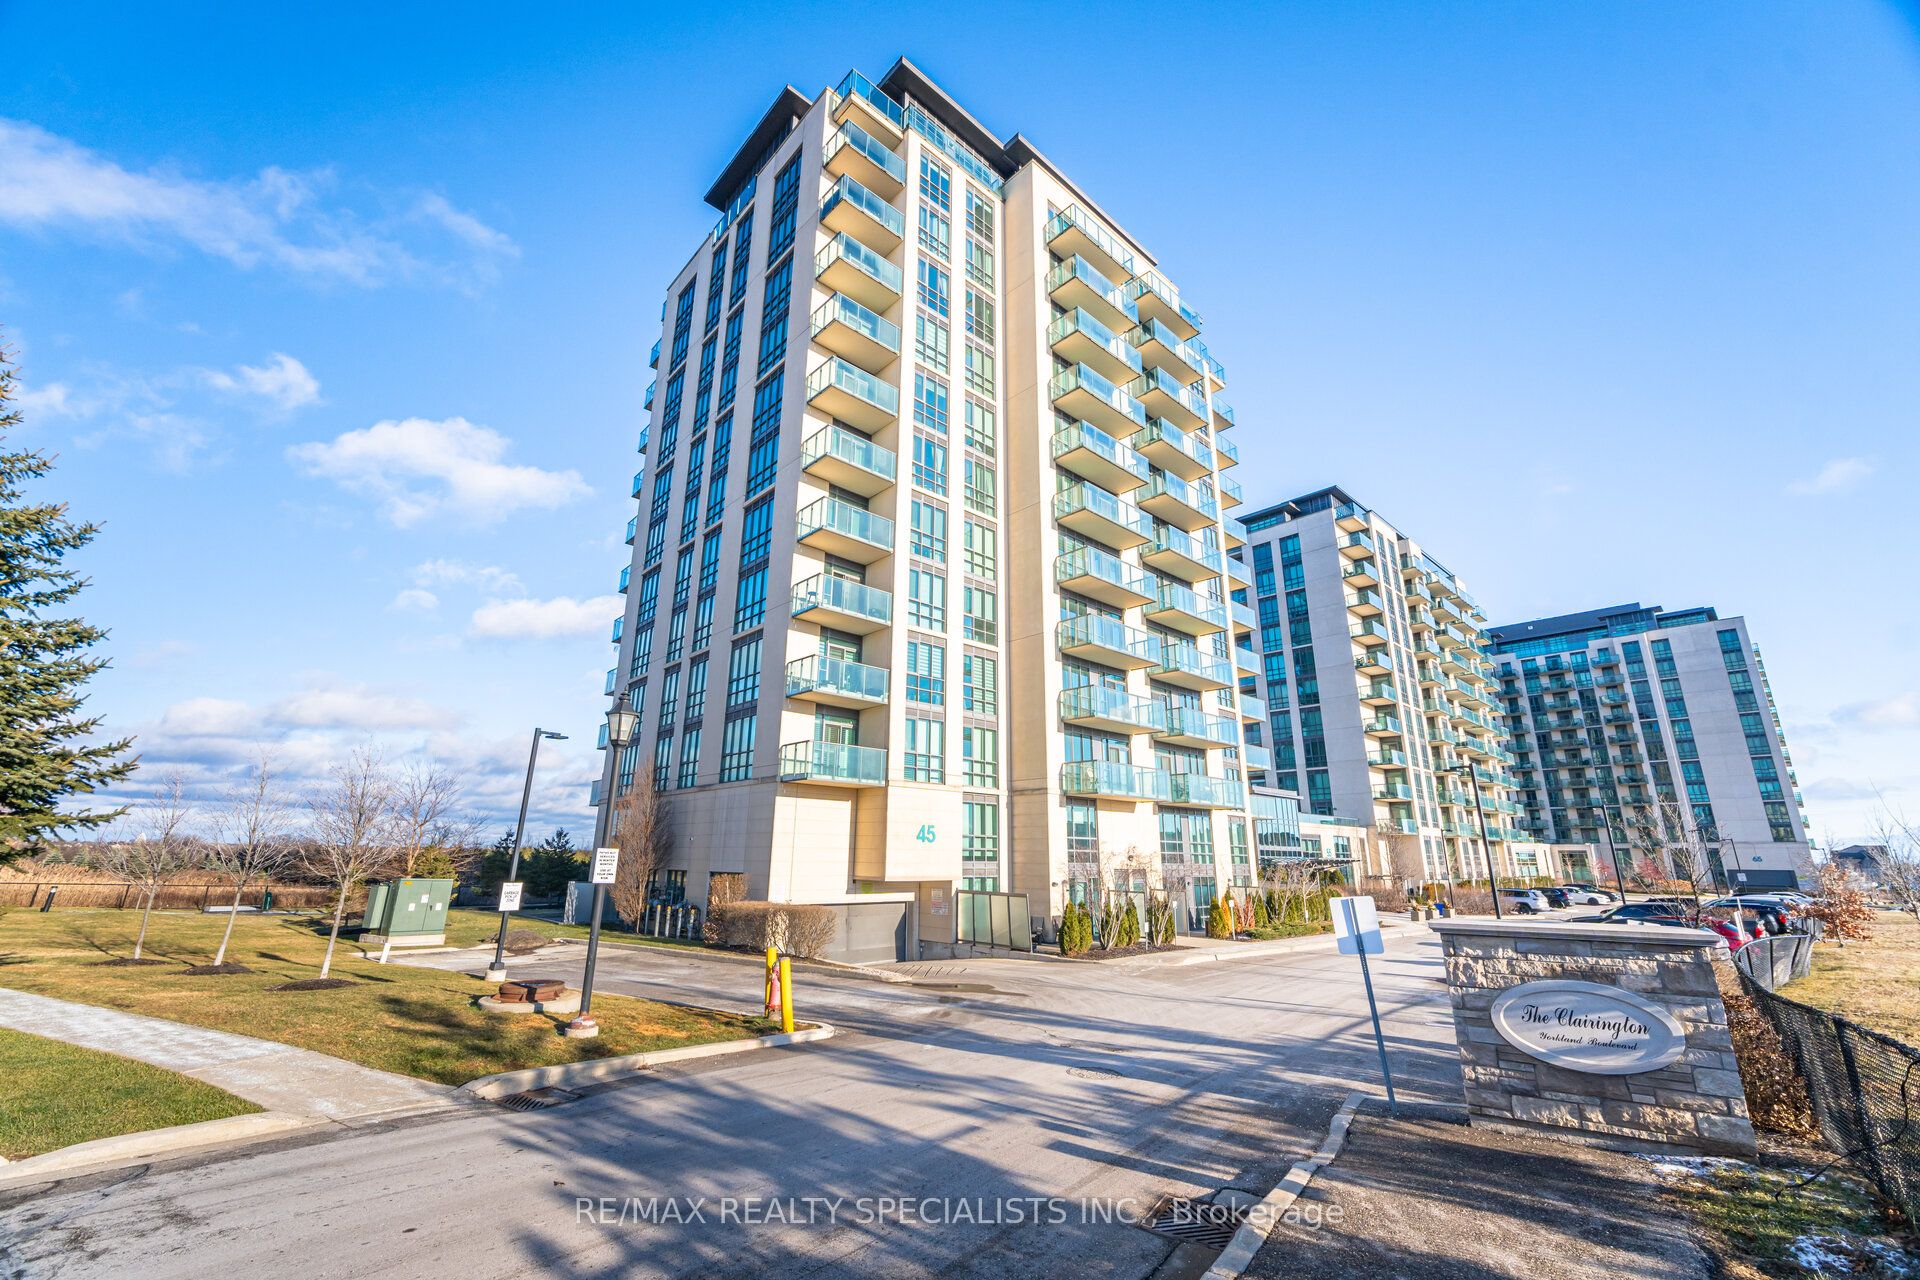
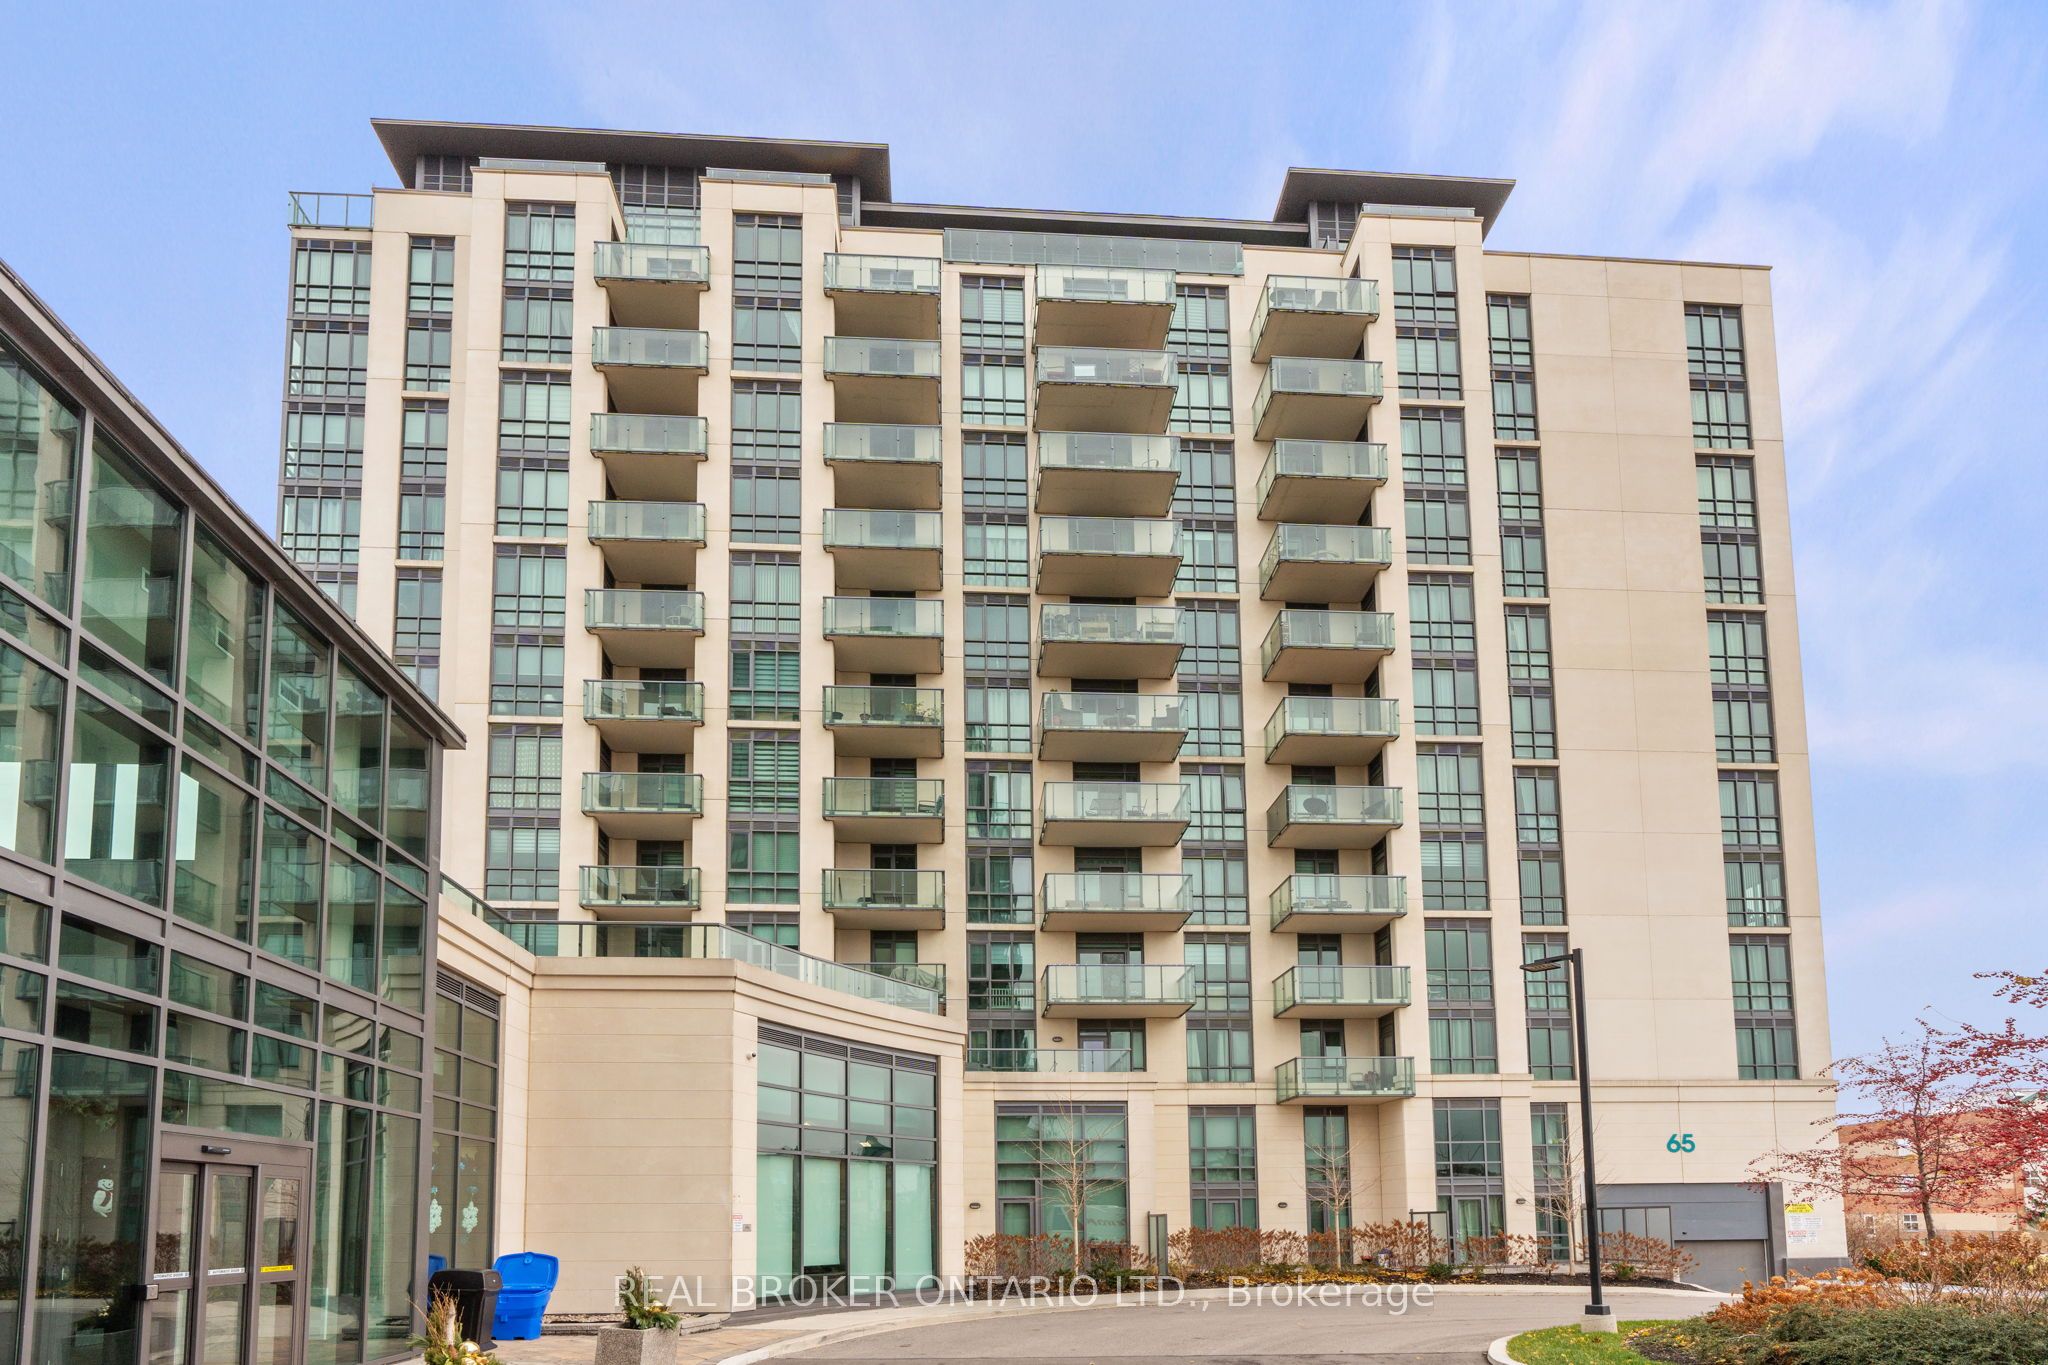
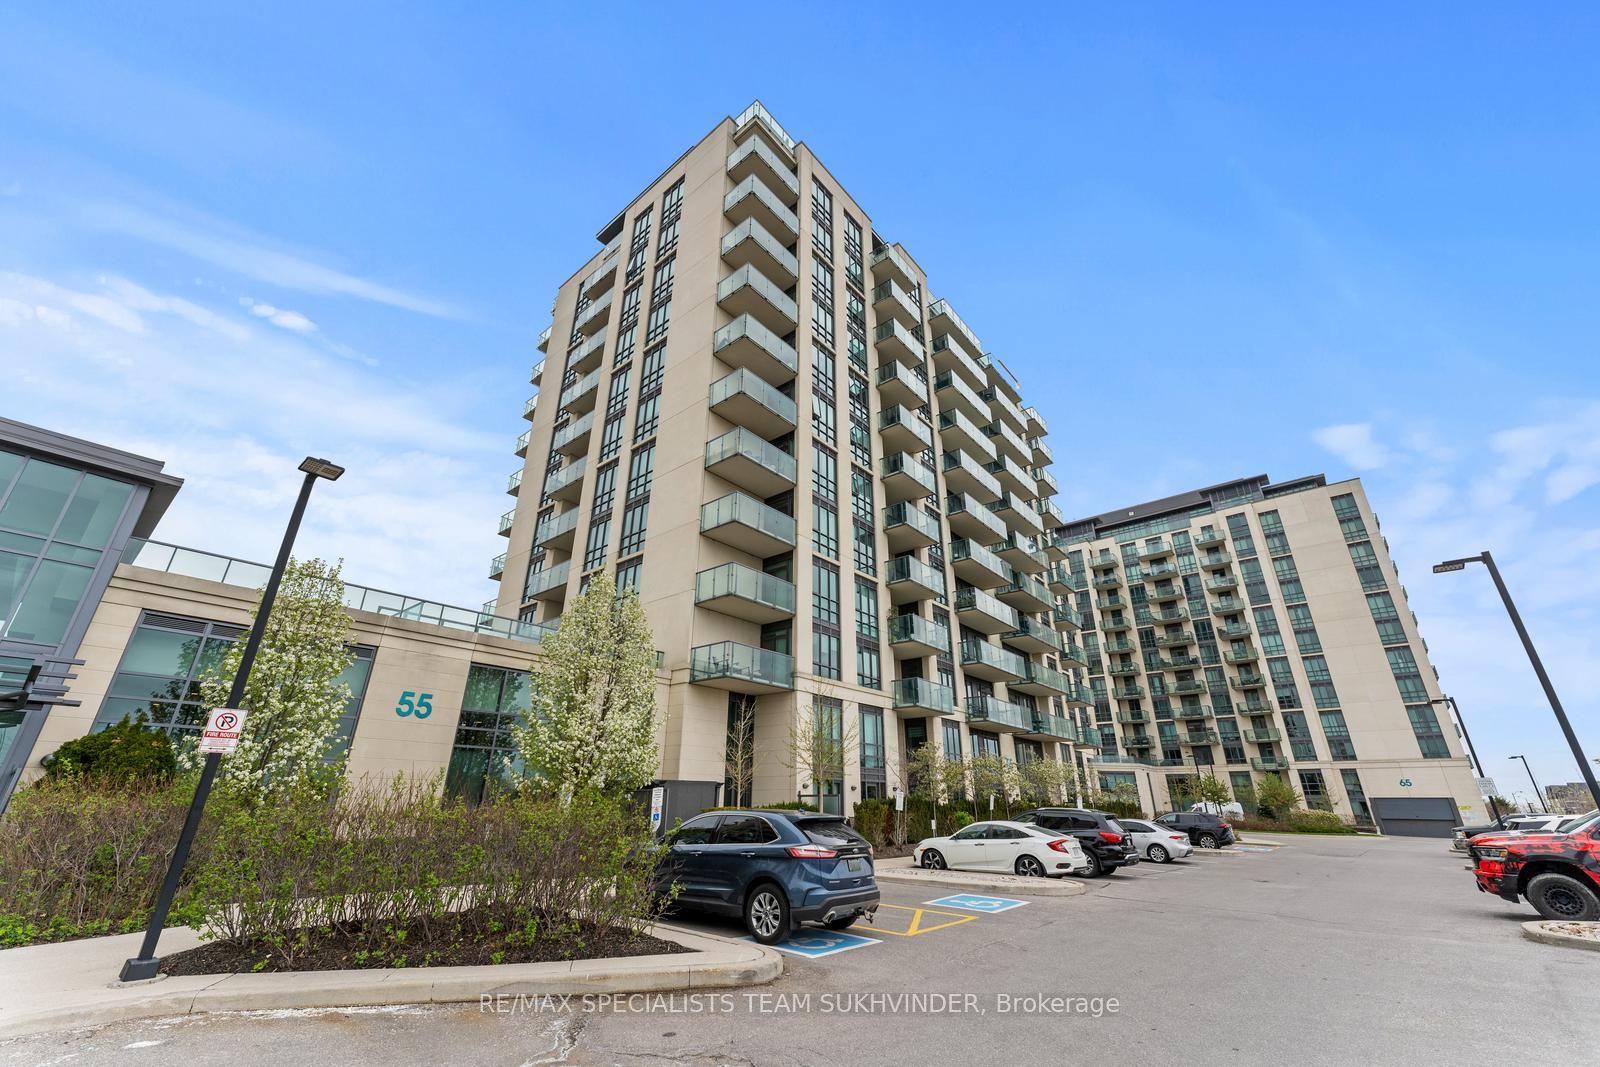
65 Yorkland Blvd #211
Goreway Drive Corridor, Brampton
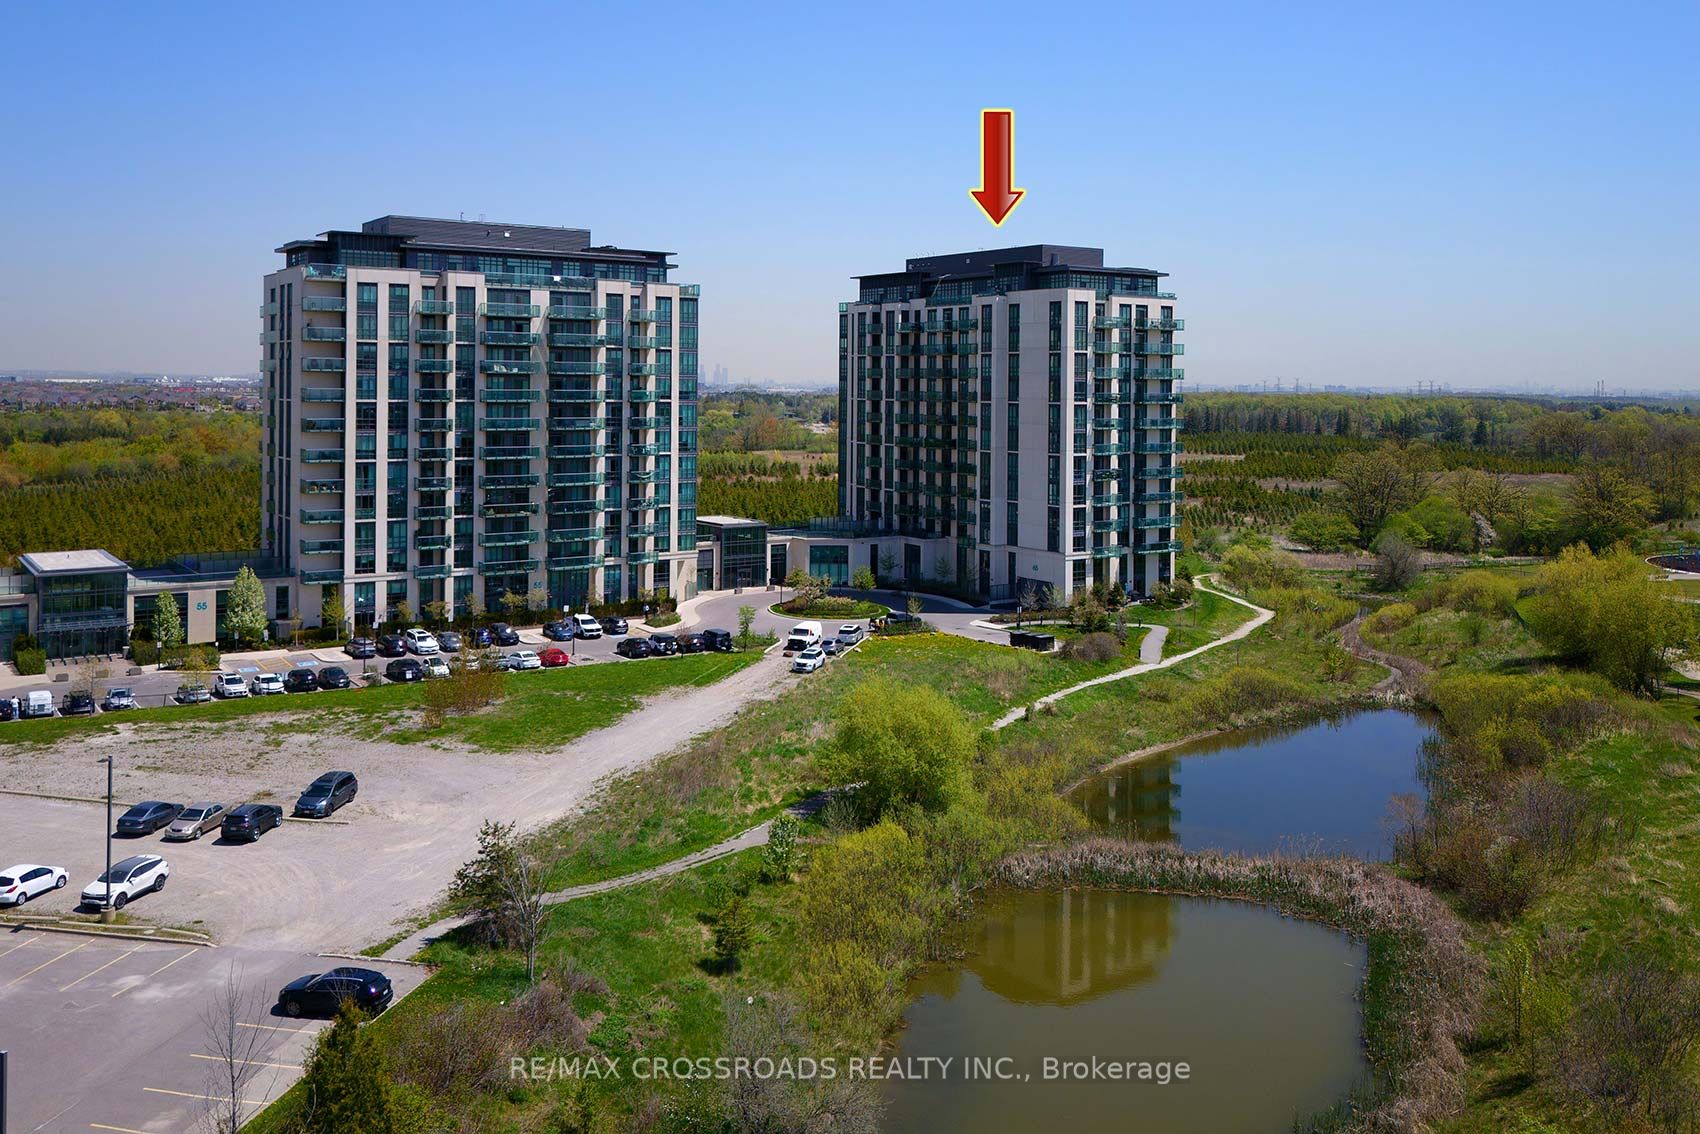
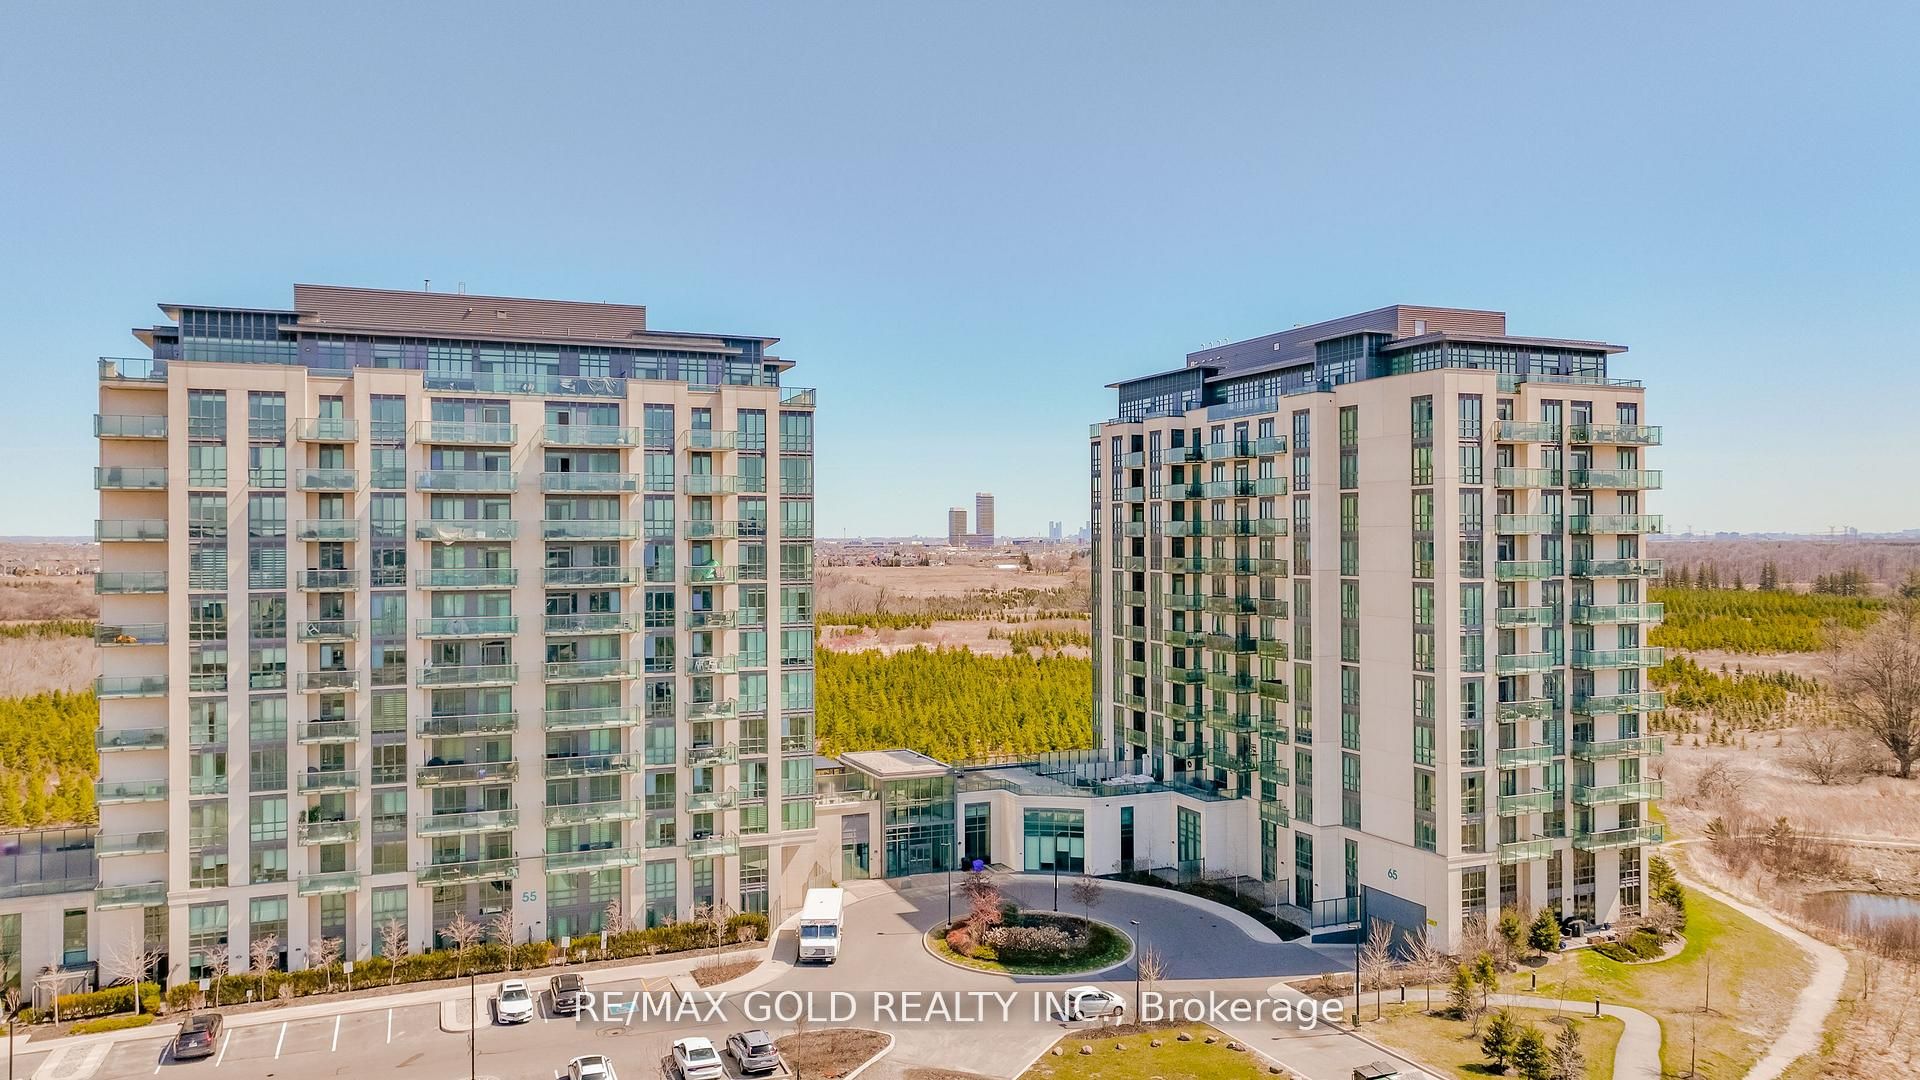
Last & Final Phase - Brand New Never Lived In - 2 Bedroom Suite Facing South With Views Of Over 800 Acres Of Claireville Conservation. Suite Is Upgraded, Granite Kitchen Countertops, Both Bathroom Granite Countertops, Laminate Flooring Throughout, 9Ft Ceiling Floor To Ceiling Windows, Large Balcony & So Much More...
Last & Final Phase - Brand New Never Lived In - 2 Bedroom Suite Facing South With Views Of Over 800 Acres Of Claireville Conservation. Suite Is Upgraded, Granite Kitchen Countertops, Both Bathroom Granite Countertops, Laminate Flooring Throughout, 9Ft Ceiling Floor To Ceiling Windows, Large Balcony & So Much More...
See MoreKey Info
- Apartment Condo
- 1 Parking
- 1-Car Underground Garage
- Goreway/Queen St
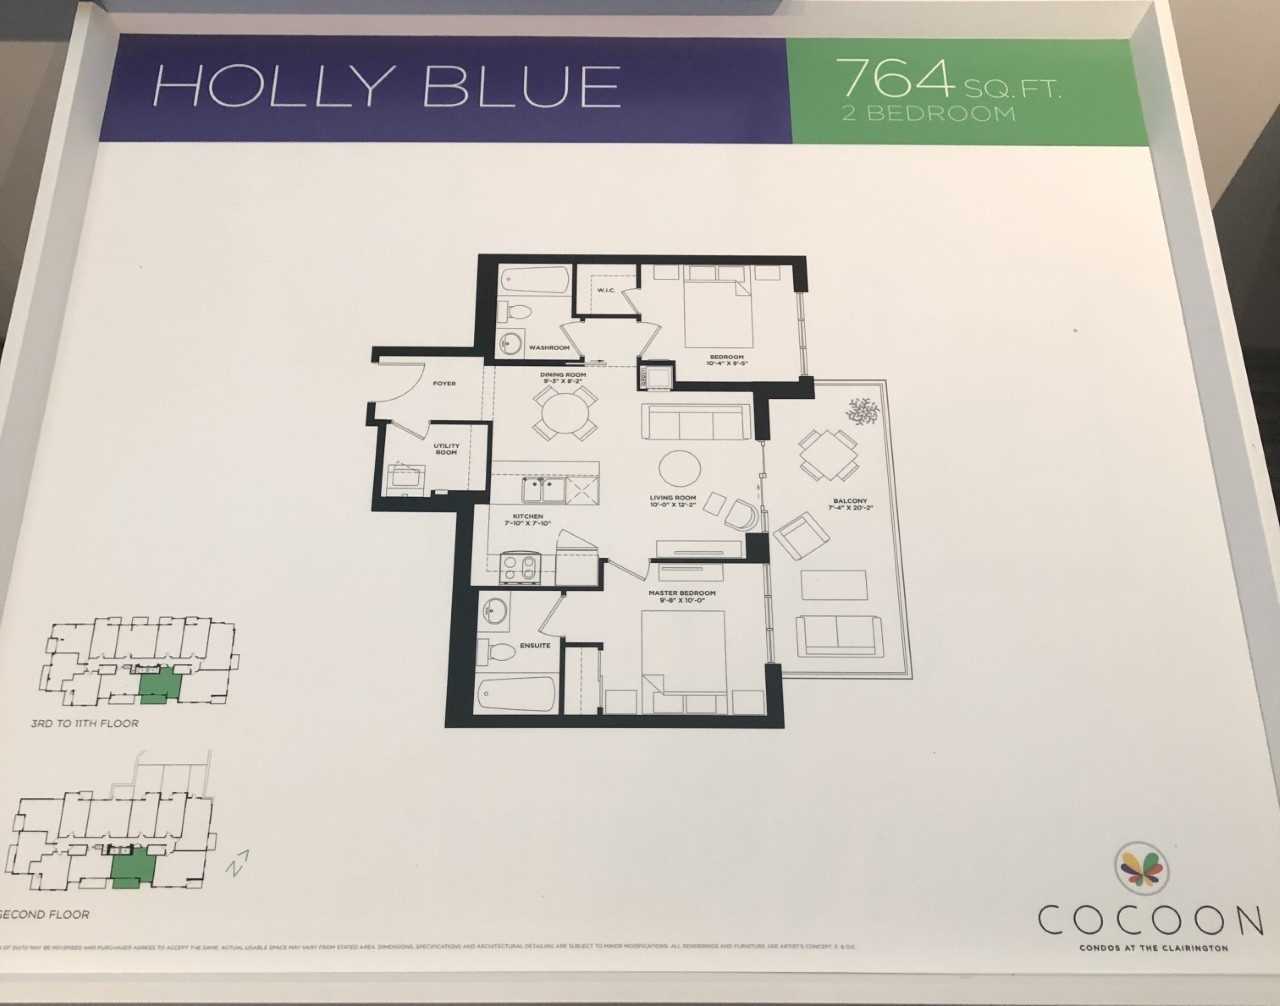
- 700-799 Approximate Sq Feet
- Pet-friendly w/Restrictions
- South Exposure
- Open Balcony
- Ensuite Laundry
- Owned Locker
- Forced Air Ground Source Heating
- Central Air
Property
- $440 Monthly Condo Fees
- Includes: Common Elements, Building Insurance, Parking.
- Excludes: Heat, Hydro, Water, Cable TV, Condo Taxes, Central A/C
- Possession: Tba
Details
- Concrete Exterior
- No Fireplace
- 1 Kitchen
- Condo Corporation #1023
- Condo Registry Office: PSCC
- MLS #W4527999
- CASTLEMORE REAL ESTATE LIMITED, BROKERAGE
Extras
- Stainless Steel Kitchen Applianes, Fridge, Stove, Dishwasher, Microwave, White Clothes Washer & Dryer 1 Underground Parking Spot & 1 Storage Locker
Rooms
| Room | Floor | Dimensions | Details | |
|---|---|---|---|---|
| 1 | Living Room | Main | Walkout To Balcony, Laminate | |
| 2 | Dining Room | Main | Laminate | |
| 3 | Kitchen | Main | Granite Counter, Stainless Steel Appliances | |
| 4 | Master Bedroom | Main | 4-PieceEnsuite, Closet, Laminate | |
| 5 | 2nd Bedroom | Main | Walk-in Closet, Laminate | |
 | 1 4-Piece Bathroom on Main Floor | |||
Who lives here?
Goreway Drive Corridor, Brampton is a west GTA neighbourhood notable for its singles and business and education, law & public sector professionals. It has a higher than average population of immigrants, particularly those recently arrived from India, and Italian speakers. Residents tend to be older with a significant number of seniors aged 65 & above.
Families
Kids Per Family
0.7
kids per family
in the neighbourhood.
Gta (1.3)
Singles
53%
of residents are
single and loving it.
53% singles
Brampton (42%)Gta (45%)
Renters
17%
of residents
are renters.
17% renters
Brampton (20%)Gta (33%)
Education
31%
of residents are
university grads.
31% university grads
Brampton (34%)Gta (44%)
Income
Average Household Income
$76K
is the average household
income in the neighbourhood.
Gta ($135K)
Professions
Professions
| Business | 13% |
| Sales | 12% |
| Government | 10% |
| Trades | 9% |
| Manufacturing | 5% |
Immigrants
59%
of residents were
born outside of Canada.
59% immigrants
Brampton (55%)Gta (45%)
Birthplace - All
24.4% from India
All-time
Birthplace - Recent
18.7% from India
Recent
Foreign Languages
Foreign Languages
| Punjabi | 13% |
| Italian | 7% |
| Hindi | 2% |
| Spanish | 2% |
| Gujarati | 2% |
Religions
Religions
| Christian | 56% |
| Hindu | 15% |
| Sikh | 12% |
| Muslim | 3% |